Survey 1
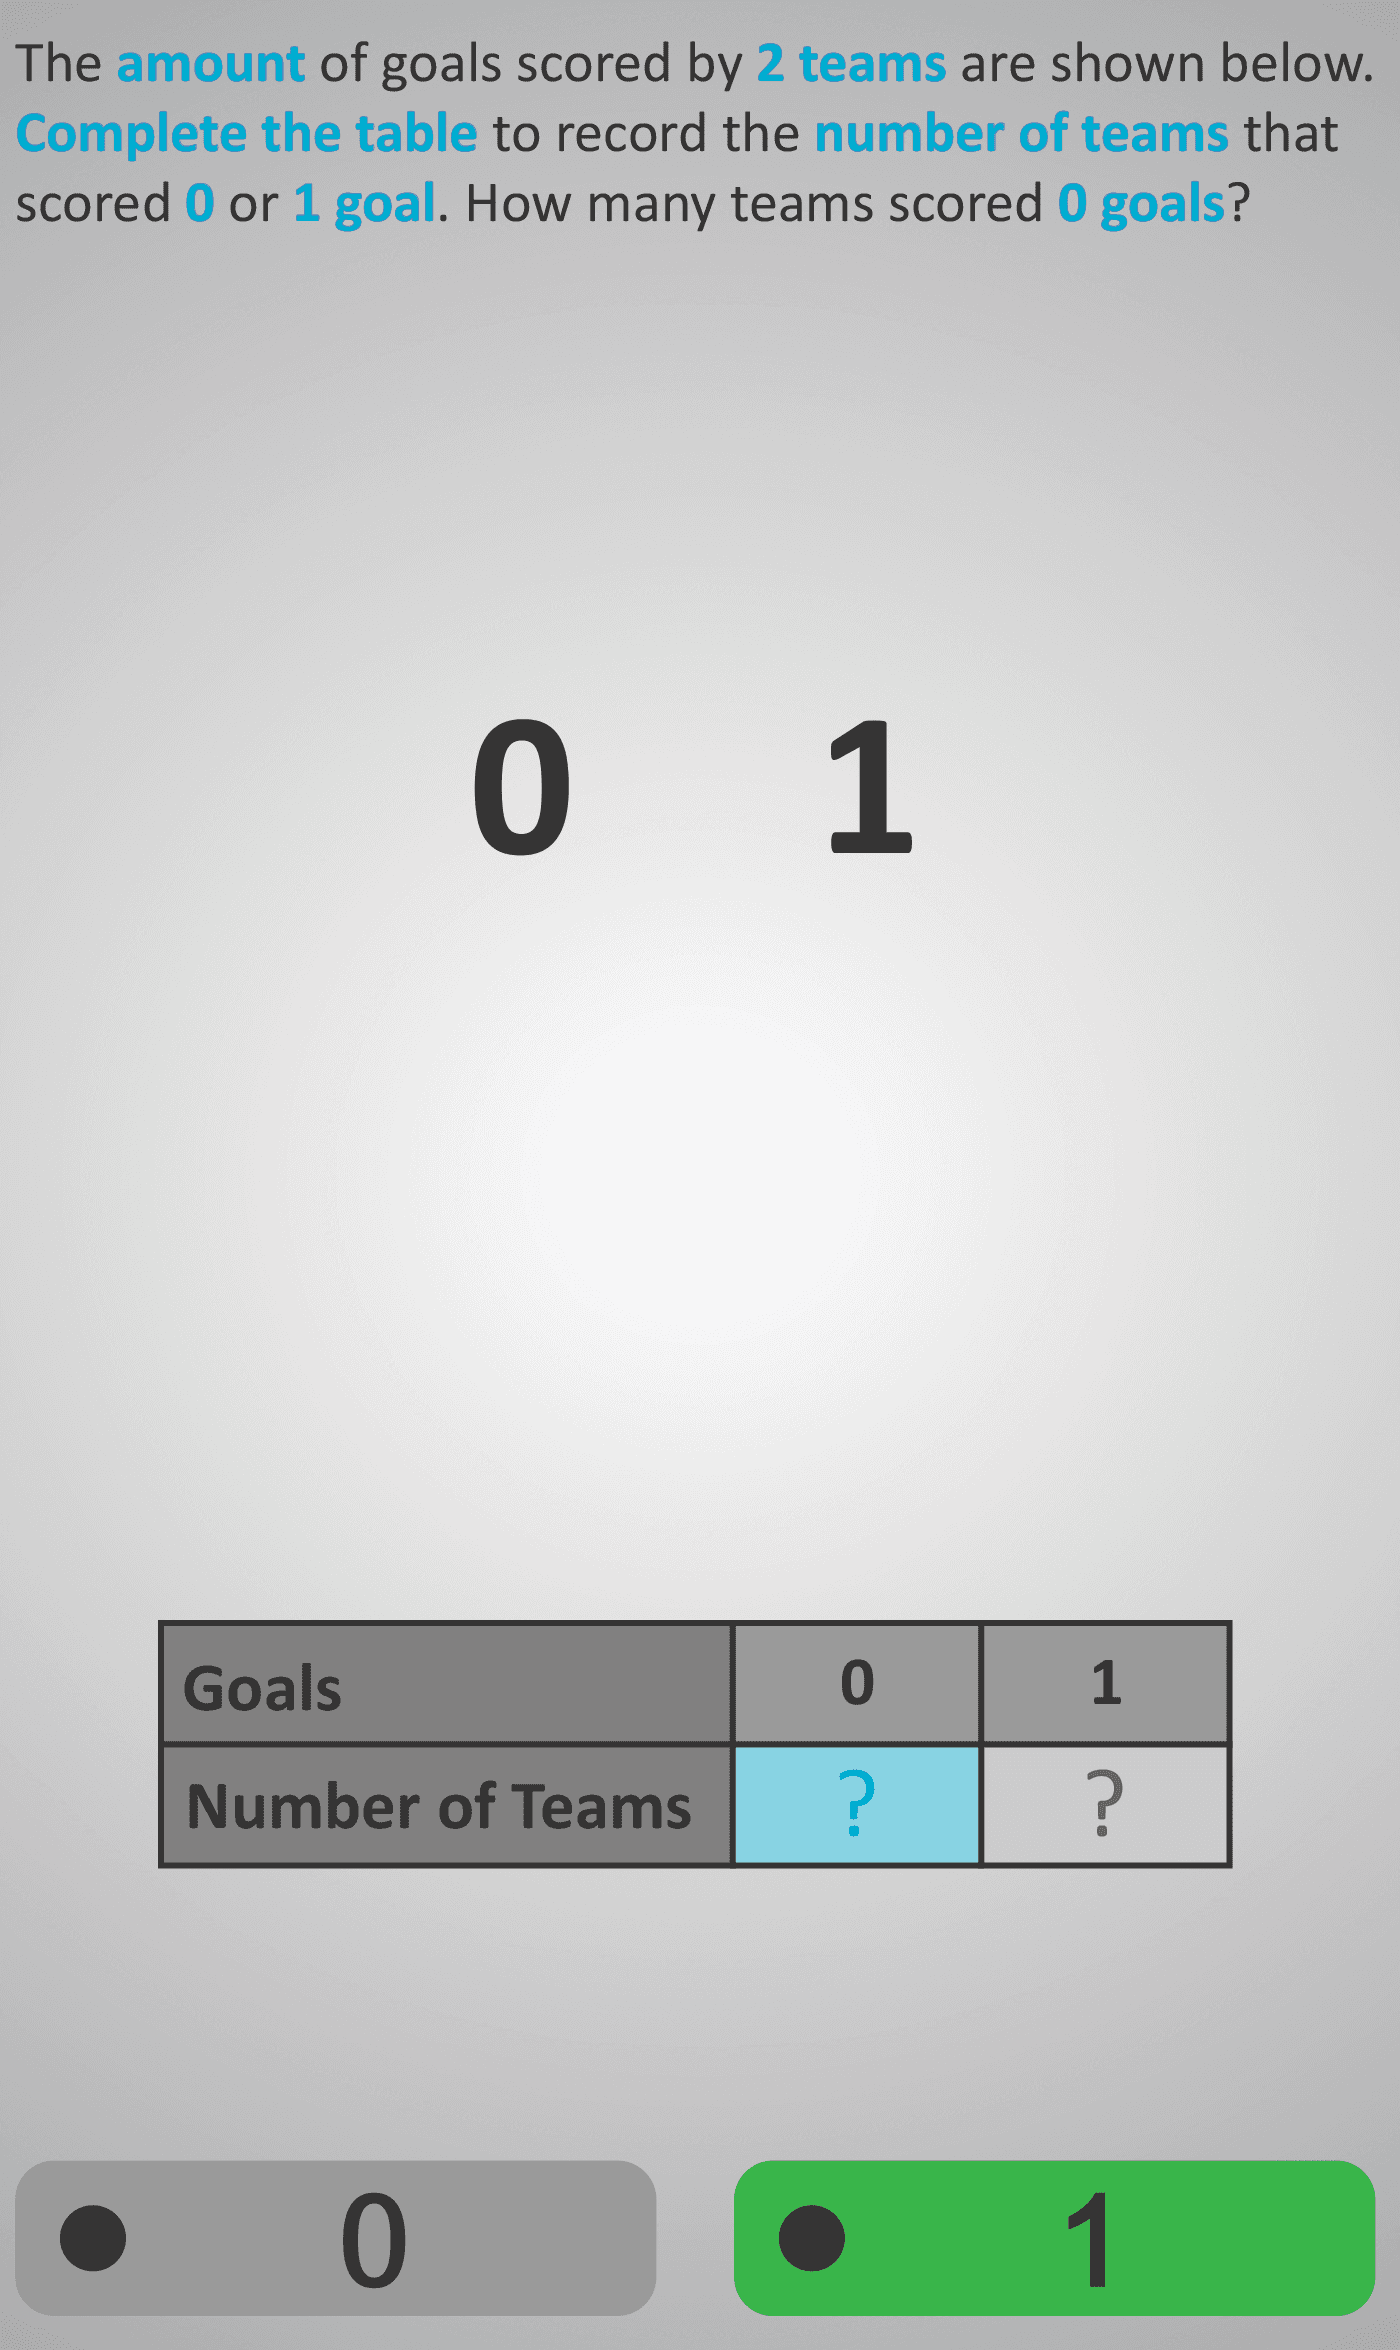
Survey 1 helps students understand how raw information can be organised into a data table. Each screen presents a short real-world example (e.g. teams scoring goals or students earning grades) and asks learners to count and record how many items fall under each heading.
The task builds confidence with the idea of frequency — how often something occurs — and shows that data can be collected and represented clearly using a table. The questions are supported by visuals that keep cognitive demand low while establishing key concepts that underpin bar charts, pictograms, and later statistical reasoning.
Prerequisite Knowledge Required:
- [Linked Phlows: Numbers 1, Count 1, Add 1]
Main Category:
Statistics
Estimated Completion Time:
Approx 6 seconds per question. 10 questions total ≈ 1 minute.
Cognitive Load / Step Size:
Small and well-scaffolded — learners move from counting single examples to filling one cell of a two-row table. Ideal for first exposure to structured data representation.
Language & Literacy Demand:
Text is concise and supported by visuals. Terms like “number of teams” and “complete the table” are reinforced by repetition. Reading demand is minimal.
Clarity & Design:
High-contrast, simple layout. Blue highlights emphasise keywords (amount, teams, table). The interface links question, data, and answer zones clearly.
Curriculum Alignment:
Aligned with the Data and Statistics strand of the Irish curriculum — “Collect, organise and represent data using tables.”
Engagement & Motivation:
Contexts such as sports and grades are relatable and meaningful, encouraging success as learners see the table fill correctly.
Error Opportunities & Misconceptions:
- Confusing the value itself (e.g. goals = 1) with the count of how many times it occurs (number of teams = 1).
Transferability / Real-World Anchoring:
Applies to sports scores, surveys, polls, attendance, and classroom data — any situation involving counting and categorising.
Conceptual vs Procedural Balance:
Strongly conceptual — introduces why data is organised before practising how to fill a table.
Learning Objectives Addressed:
- Recognise that data can be organised using tables.
- Count and record frequencies for simple categories.
- Distinguish between a data item and its frequency.
- Interpret basic results from a simple dataset.
What Your Score Says About You:
- Less than 5: Still mixing up value vs frequency — revisit examples slowly.
- 6–7: Counting accurately — practise filling the table consistently.
- 8–9: Matching data with categories correctly — excellent progress!
- 10/10: Can confidently record and interpret data — ready for pictograms & bar charts next.