Venn Diagram 1B
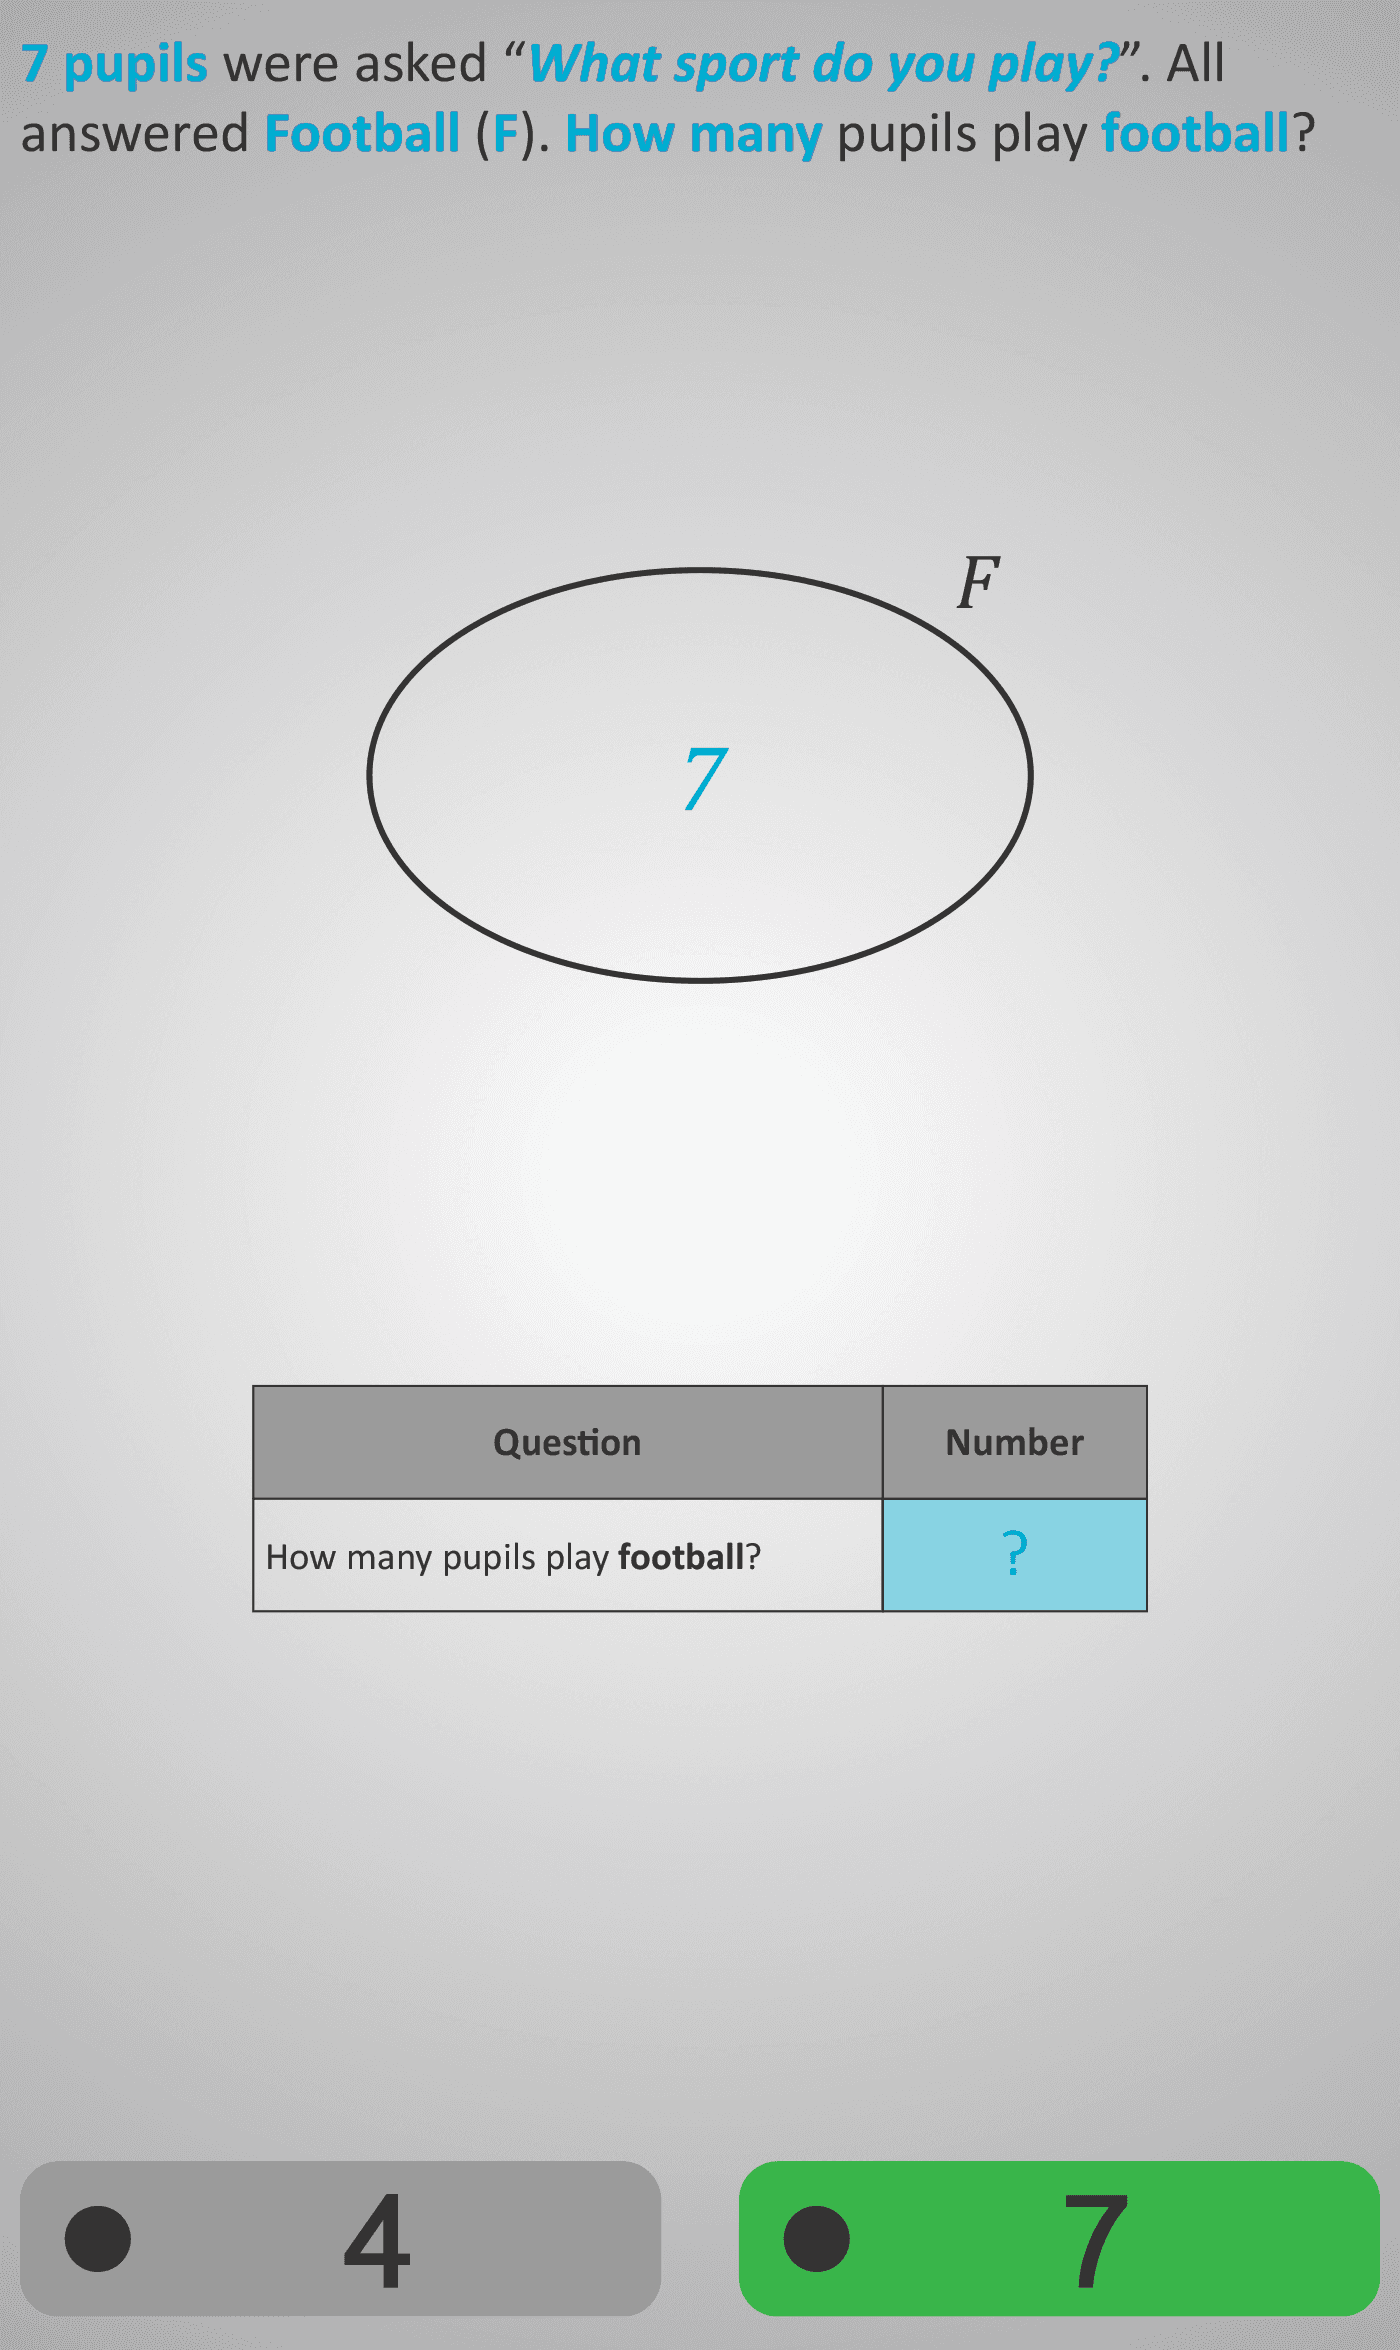
Venn Diagram 1B introduces the concept of representing data using single-set Venn Diagrams. Each question presents a short real-world scenario (e.g., “7 pupils play football”) and asks students to identify the number of pupils belonging to that category. The task builds intuitive understanding of how a Venn Diagram represents membership of a group.
The set is labelled (F, G, or T), corresponding to categories such as Football, Golf, and Tennis. Students are guided through different examples that all follow the same pattern, reinforcing the connection between the verbal description (“How many pupils play tennis?”), the symbol (e.g., T), and the numerical content (e.g., 9 inside the circle).
By the end of this Phlow, learners should confidently interpret and read one-set diagrams — a key foundation before advancing to overlapping or comparative sets in later levels.
Prerequisite Knowledge Required:
- Understanding of basic number recognition (1–10)
- Familiarity with reading simple tables and labels
- Prior exposure to the idea of a set (see Sets 1 and Venn Diagram 1A)
Linked Previous Phlows:
- Sets 1
- Venn Diagram 1A
Main Category:
Data & Representation
Estimated Completion Time:
Approx. 6 seconds per question × 10 questions = 1 minute total
Cognitive Load / Step Size:
Very low. Each step builds on the same structure with slight variation. Transitions are small and predictable, making it ideal for consolidating understanding without cognitive overload.
Language & Literacy Demand:
Simple, structured sentences with repeated phrasing (“How many pupils play ___?”). Minimal text and strong visuals reduce literacy barriers and keep focus on mathematical meaning.
Clarity & Design:
Uses consistent visual cues: blue text for key terms, clear Venn circles with numbers inside, and tables that align text and visuals. The design visually reinforces the link between question, diagram, and answer field.
Curriculum Alignment:
Strand: Statistics and Probability
Learning Outcome: Represent data graphically and interpret representations of data. This Phlow introduces the foundational skill of interpreting a single-category diagram.
Engagement & Motivation:
Survey contexts (e.g., sports participation) are relatable and engaging, helping learners connect mathematical ideas to real-life examples. The quick feedback loop supports confidence and flow.
Error Opportunities & Misconceptions:
- Misreading the number inside the circle as a value to calculate rather than interpret
- Mixing up category labels (F for Football, G for Golf, etc.)
- Confusing total number surveyed with the number belonging to the set
Transferability / Real-World Anchoring:
Directly applies to reading and understanding real-world survey results, charts, and infographics. Builds fluency for data interpretation in daily and academic contexts.
Conceptual vs Procedural Balance:
Primarily conceptual — emphasises understanding what a Venn circle represents rather than performing calculations.
Learning Objectives Addressed:
- Recognise that a set represents a group of related elements or members
- Identify the number of elements in a single set from a Venn Diagram
- Interpret categorical data in both textual and diagrammatic form
- Develop fluency connecting everyday data with mathematical representation
What Your Score Says About You:
- Less than 5: You’re still learning how Venn Diagrams show information — review Sets 1 again.
- 6–7: You understand the link between category names and numbers; just need more practice reading quickly.
- 8–9: You’re interpreting diagrams well and ready to move toward comparing sets.
- 10/10: Excellent! You fully understand single-set Venn Diagrams — ready for overlapping sets next.