Analyse 2A
Overview
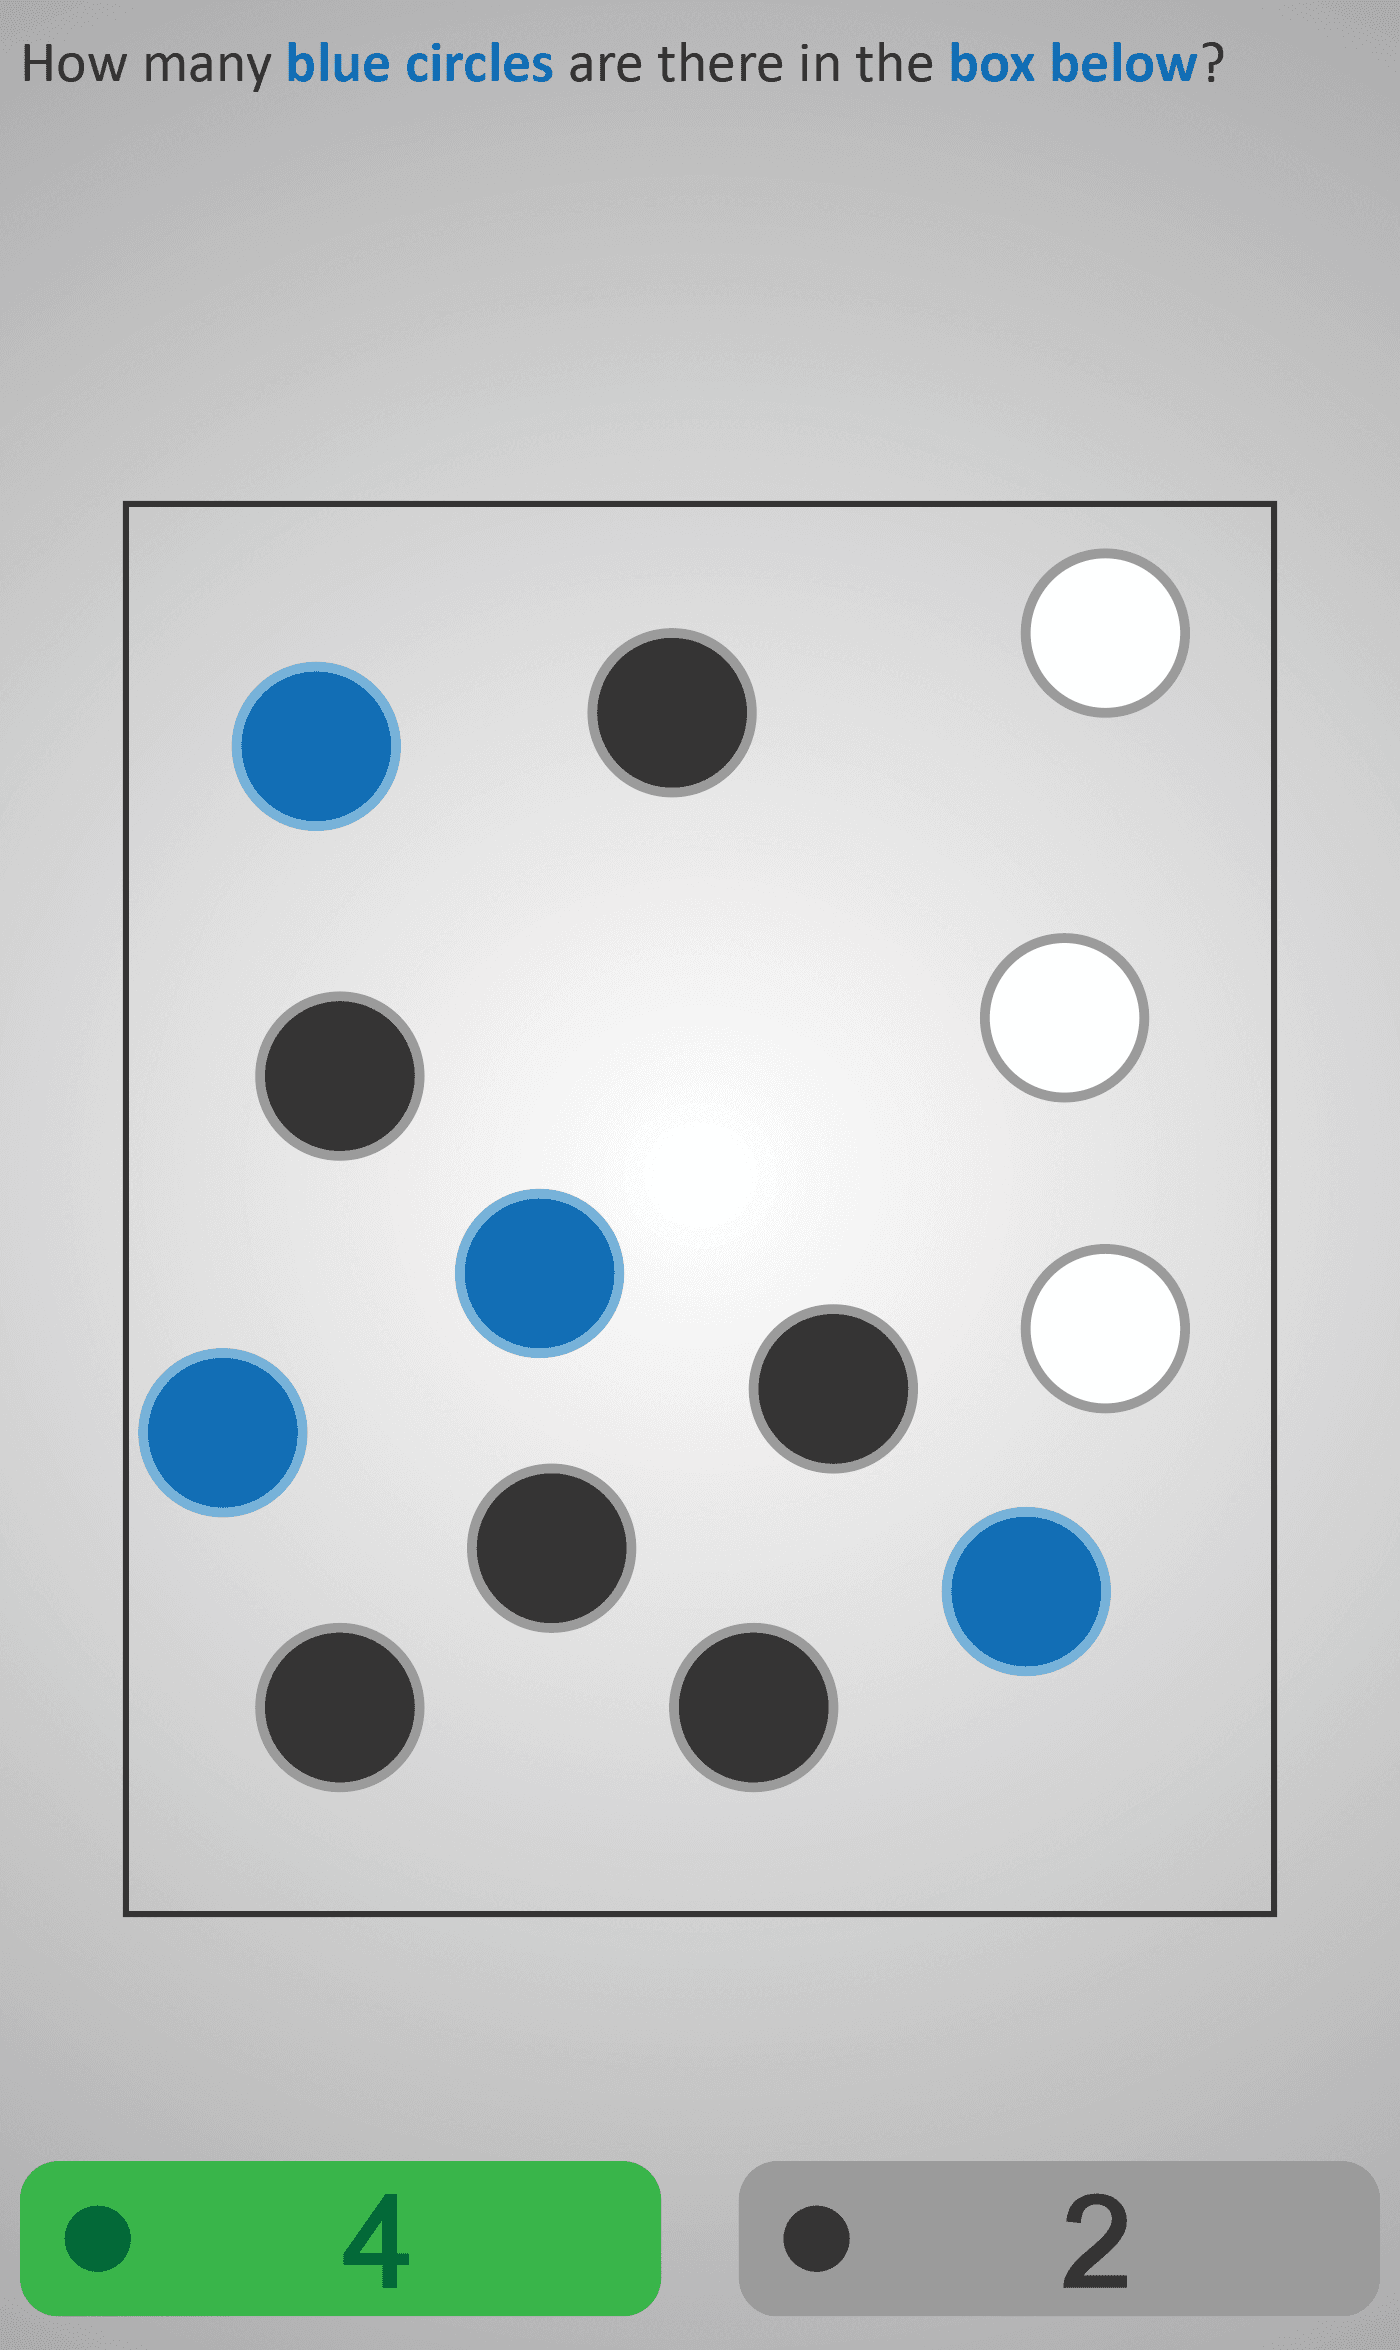
Introduces students to identifying and counting specific features in sets of objects, using colour and shape recognition as the foundation for analytical thinking. The Phlow begins by asking students to count how many blue circles are present in a given box, encouraging careful observation and visual discrimination. As the tasks progress, the number of colours and shapes increases, requiring students to focus more intently and avoid distractions from irrelevant items.
This Phlow builds early data analysis skills by training learners to filter information, attend to detail, and systematically categorise items based on given criteria. It supports the development of accuracy and concentration, while reinforcing key mathematical processes such as classification and tallying. The gradual increase in complexity ensures that students remain within their zone of proximal development—advancing from straightforward identification to working with multiple colours and competing stimuli.
By the end of Analyse 2A, students strengthen both their visual analysis skills and their ability to extract meaningful information from structured data sets. These skills are foundational not just for statistics and probability, but also for broader problem-solving in mathematics and beyond.
Prerequisite Knowledge Required
- Recognising and naming basic colours and shapes.
- Counting accurately and understanding the concept of grouping.
- Prior exposure to single-feature identification (see Analyse 1A, Analyse 1B).
Main Category
Data & Analysis
Estimated Completion Time
Approx 6-10 seconds per question. 20 questions total. Total time: 2-4 minute.
Cognitive Load / Step Size
Low to moderate — early tasks are simple, focusing on one attribute at a time. Later screens gradually introduce additional features, increasing cognitive demand without overwhelming learners.
Language & Literacy Demand
Minimal — relies primarily on visual recognition with brief, clear instructions (e.g., “How many blue circles?”). Suitable for learners with limited reading proficiency or early English acquisition.
Clarity & Design
Uses clean, uncluttered layouts with distinct colours and shapes. Visual contrast supports comprehension and minimises confusion. Design prioritises clarity over decoration, ensuring that every element serves a purpose.
Curriculum Alignment
Aligned with the Statistics and Probability strand of the Irish Junior Cycle mathematics curriculum: “Represent, interpret, and analyse data using appropriate methods.”
Engagement & Motivation
Highly interactive and visually stimulating. Learners experience satisfaction through quick, accurate recognition tasks and immediate feedback, maintaining motivation through short, achievable steps.
Error Opportunities & Misconceptions
- Possible confusion when multiple attributes are present (e.g., counting all blue items instead of just blue circles).
- Overlooking one of the categories when multiple features are introduced.
Transferability / Real-World Anchoring
Skills apply directly to reading charts, interpreting data, organising information, and filtering relevant details in real-world contexts like surveys or visual information processing.
Conceptual vs Procedural Balance
Balanced — students practise procedural counting while conceptually learning how to classify and analyse visual data systematically.
Learning Objectives Addressed
- Identify and count specific features in visual sets.
- Develop attention to detail and systematic observation.
- Classify and interpret visual information using multiple criteria.
- Build early data-handling and analytical reasoning skills.
What Your Score Says About You
- Less than 5: You may be missing key visual details — try to focus on one feature at a time.
- Between 6–7: You can identify features but occasionally mix categories.
- Between 8–9: Strong analytical attention with minor lapses in accuracy.
- 10/10: Excellent visual discrimination and data awareness — ready for more complex analysis tasks.