Analyse 2C
Overview
This Phlow develops students’ ability to correctly interpret values on graphs, particularly from the vertical axis (y-axis). The lesson introduces simple line graphs with labelled axes (Days of the Week or Months of the Year) and highlights the importance of reading what the numbers represent.
Students are asked questions such as:
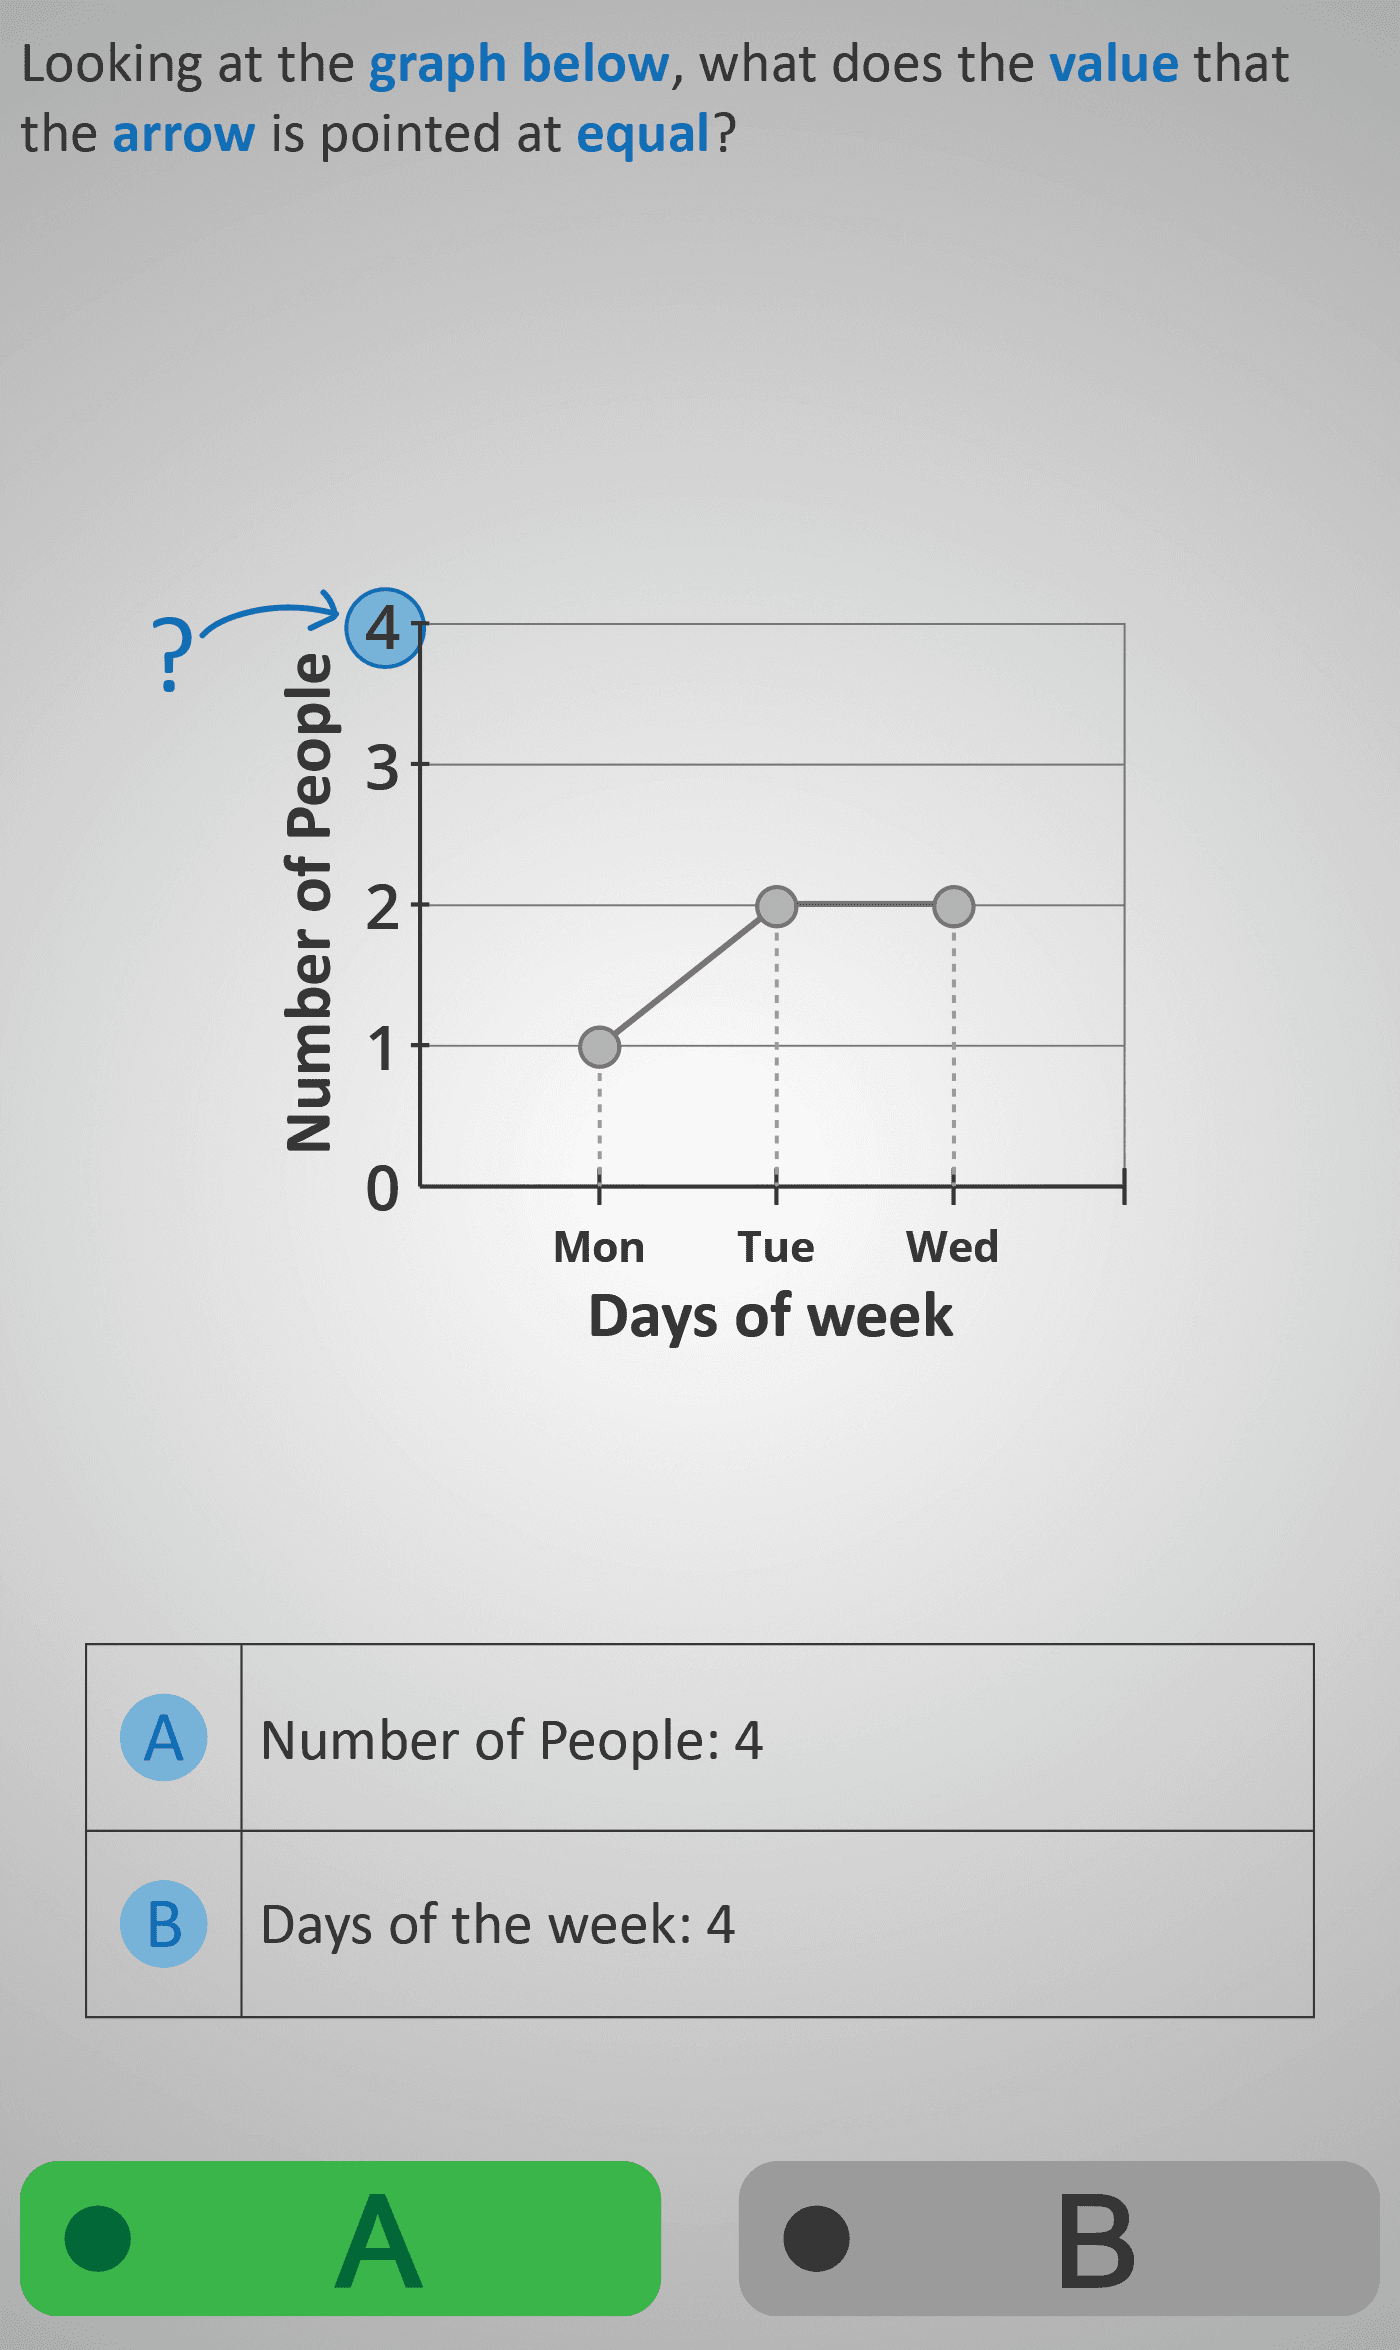
- “Looking at the graph below, what does the value that the arrow is pointed at equal?”
- “Which of A or B shows Number of People: 4?”
- “What does the value of 8 on the vertical axis mean in the context of this graph?”
The tasks guide learners to recognise that numbers on the vertical axis represent quantities (e.g., number of people, number of days), not the horizontal categories. The multiple-choice answers are designed to test whether students confuse the axes (e.g., selecting “Days of the week: 4” instead of “Number of People: 4”).
Through repetition with different contexts (people over days, days over months), students practise focusing on the axis labels and linking them to the values being pointed at. This ensures they not only read graphs correctly but also understand what the numbers mean in context.
Learning focus:
- Strengthen vertical axis interpretation skills.
- Distinguish between quantities and categories on graphs.
- Prevent common axis mix-ups by emphasising context.
Prerequisite Knowledge Required
- Familiarity with basic bar or line graphs (see Analyse 1B and Survey 1).
- Understanding that graphs display quantities and categories.
- Ability to read simple numerical scales up to at least 10.
- Early exposure to comparing data values.
Main Category
Data & Graph Interpretation
Estimated Completion Time
Approx 6-10 seconds per question. 20 questions total. Total time: 2-4 minute.
Cognitive Load / Step Size
Moderate — requires attention to both numeric values and labels, but remains within a single focus (vertical axis). Progression between questions gradually shifts context rather than increasing numerical difficulty, maintaining cognitive flow.
Language & Literacy Demand
Low to moderate. Questions use concise phrasing but include data-specific terms (“vertical axis,” “Number of People,” “Days of the Week”) which may require prior exposure. Visual context reduces reading demand.
Clarity & Design
Uses clean, uncluttered line or bar graphs with clear axis labels and arrows pointing to specific values. The design emphasises axis reading rather than decorative elements, ensuring students attend to the correct part of the graph.
Curriculum Alignment
Supports the Statistics and Data strand of the Irish Junior Cycle mathematics curriculum: “Interpret graphical representations of data; identify what quantities and categories are being represented on each axis.”
Engagement & Motivation
Relatable contexts (e.g., daily routines, number of people) make the data meaningful. The arrow prompt and visual cues encourage active observation rather than passive guessing.
Error Opportunities & Misconceptions
- Confusing the horizontal and vertical axes.
- Reading the category label (e.g., “Wednesday”) instead of the quantity (e.g., “4 people”).
- Misreading the scale on the vertical axis (e.g., skipping increments).
Transferability / Real-World Anchoring
Highly transferable — applies to reading charts in everyday life (surveys, sports scores, attendance graphs, etc.).
Conceptual vs Procedural Balance
Conceptual — focuses on interpreting meaning and understanding graphical structure rather than performing calculations.
Learning Objectives Addressed
- Identify and interpret values shown on the vertical (y) axis of a graph.
- Distinguish between categories (x-axis) and quantities (y-axis).
- Apply contextual reasoning to understand what numerical values represent.
- Develop accuracy in reading and comparing data from simple graphs.
What Your Score Says About You
- Less than 5: You may be mixing up axes or missing what each label represents — review graph structure.
- Between 6–7: You understand basic graph reading but occasionally confuse quantities and categories.
- Between 8–9: You can read most graphs accurately and interpret data with confidence.
- 10/10: Excellent comprehension of axis reading and contextual interpretation — ready for more complex multi-variable graphs.