Mode 2
Overview
In this sequence of questions, students learn how to identify the mode, which is the number that appears most often in a data set. The activity uses a step-by-step approach with worked examples and interactive choices.
The first examples present small sets of numbers where one value is repeated (e.g., 7, 5, 5). Students are asked to choose which number occurs most frequently, reinforcing that the mode is about frequency, not size.
Additional examples follow with different values (e.g., 3, 1, 3 or 8, 4, 4), giving practice across multiple contexts while keeping the process simple and repetitive.
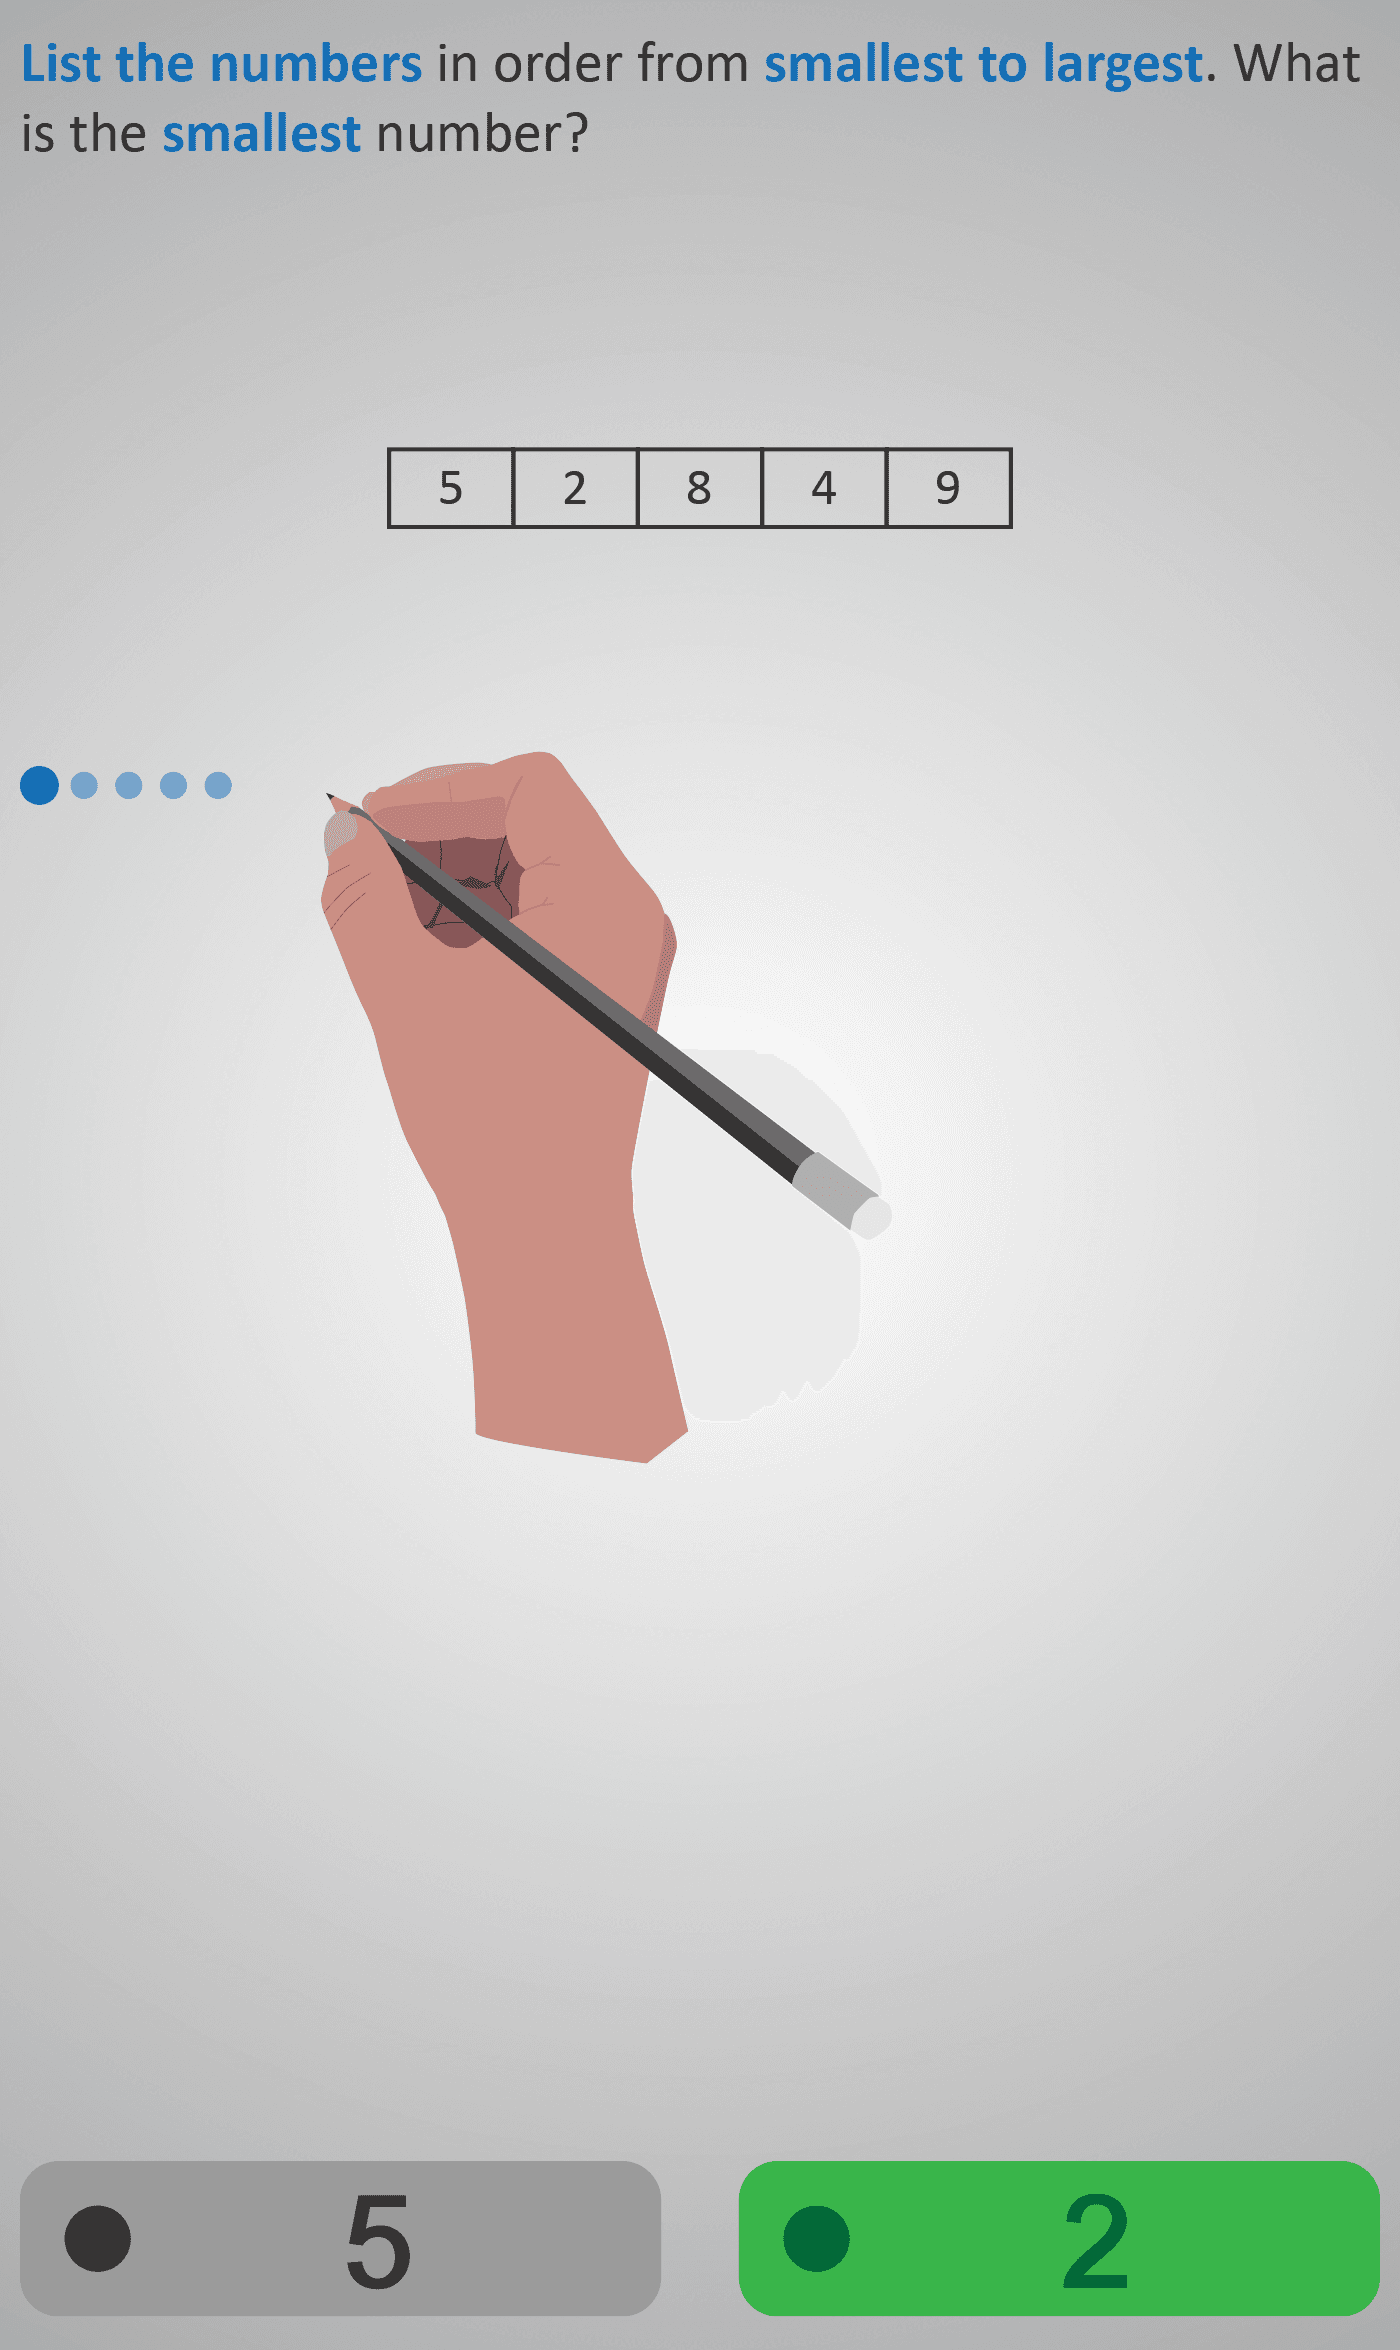
The final sequence provides a slightly larger data set (e.g., 5, 2, 8, 4, 9). Students are guided step by step to order the numbers from smallest to largest and then reason through which number occurs most often.
This Phlow helps learners distinguish the mode from other measures of central tendency (mean and median) by focusing only on repetition. The visual reinforcement (numbers displayed in boxes) and progressive scaffolding build confidence and accuracy in recognising the mode.
Prerequisite Knowledge Required
- Ability to read and compare numbers in a list (see Numbers 1 and Analyse 2B).
- Basic understanding of data sets and the concept of frequency.
- Prior exposure to ordering numbers (see Median 2).
Main Category
Statistics
Estimated Completion Time
Approx 6-10 seconds per question. 20 questions total. Total time: 2-4 minute.
Cognitive Load / Step Size
Low to moderate — begins with clear two- or three-number examples and progresses to slightly larger sets, maintaining manageable cognitive demand through repetition and visual layout.
Language & Literacy Demand
Low — uses short, clear prompts like “Which number occurs most often?”. Visual presentation of numbers in boxes reduces reliance on reading comprehension.
Clarity & Design
Highly visual and accessible. The use of boxed numbers makes repetition stand out, helping learners quickly spot patterns. Gradual progression supports both conceptual understanding and procedural fluency.
Curriculum Alignment
Irish Junior Cycle Mathematics – Statistics and Probability Strand:
- “Identify and calculate the mode as a measure of central tendency for a given data set.”
Engagement & Motivation
Frequent visual reinforcement and quick feedback create a sense of progress. Learners enjoy identifying patterns — a naturally satisfying and low-stress task that promotes confidence.
Error Opportunities & Misconceptions
- Confusing the mode with the highest or middle value.
- Overlooking repetition in larger sets.
Transferability / Real-World Anchoring
Recognising the mode connects to real-life contexts such as finding the most popular choice in a survey, the most common test score, or the most frequent shoe size — making statistics tangible and relevant.
Conceptual vs Procedural Balance
Conceptual — focuses on understanding what the mode represents and how to recognise it visually. Procedure (counting frequency) reinforces the concept naturally.
Learning Objectives Addressed
- Identify the mode as the most frequent number in a data set.
- Differentiate the mode from mean and median.
- Practise recognising repetition patterns in both small and medium-sized data sets.
- Build confidence in interpreting basic statistical data.
What Your Score Says About You
- Less than 5: Needs more practice distinguishing mode from other measures.
- 6–7: Understands the concept but may overlook repetition in larger sets.
- 8–9: Accurately identifies mode across all examples.
- 10/10: Fully confident — ready to apply mode to grouped or real-world data.