Pie Chart 2B
Overview
In this Phlow, students deepen their understanding of how tables and pie charts represent data together. The activity links survey results to angles in a circle, building both number sense and data interpretation skills.
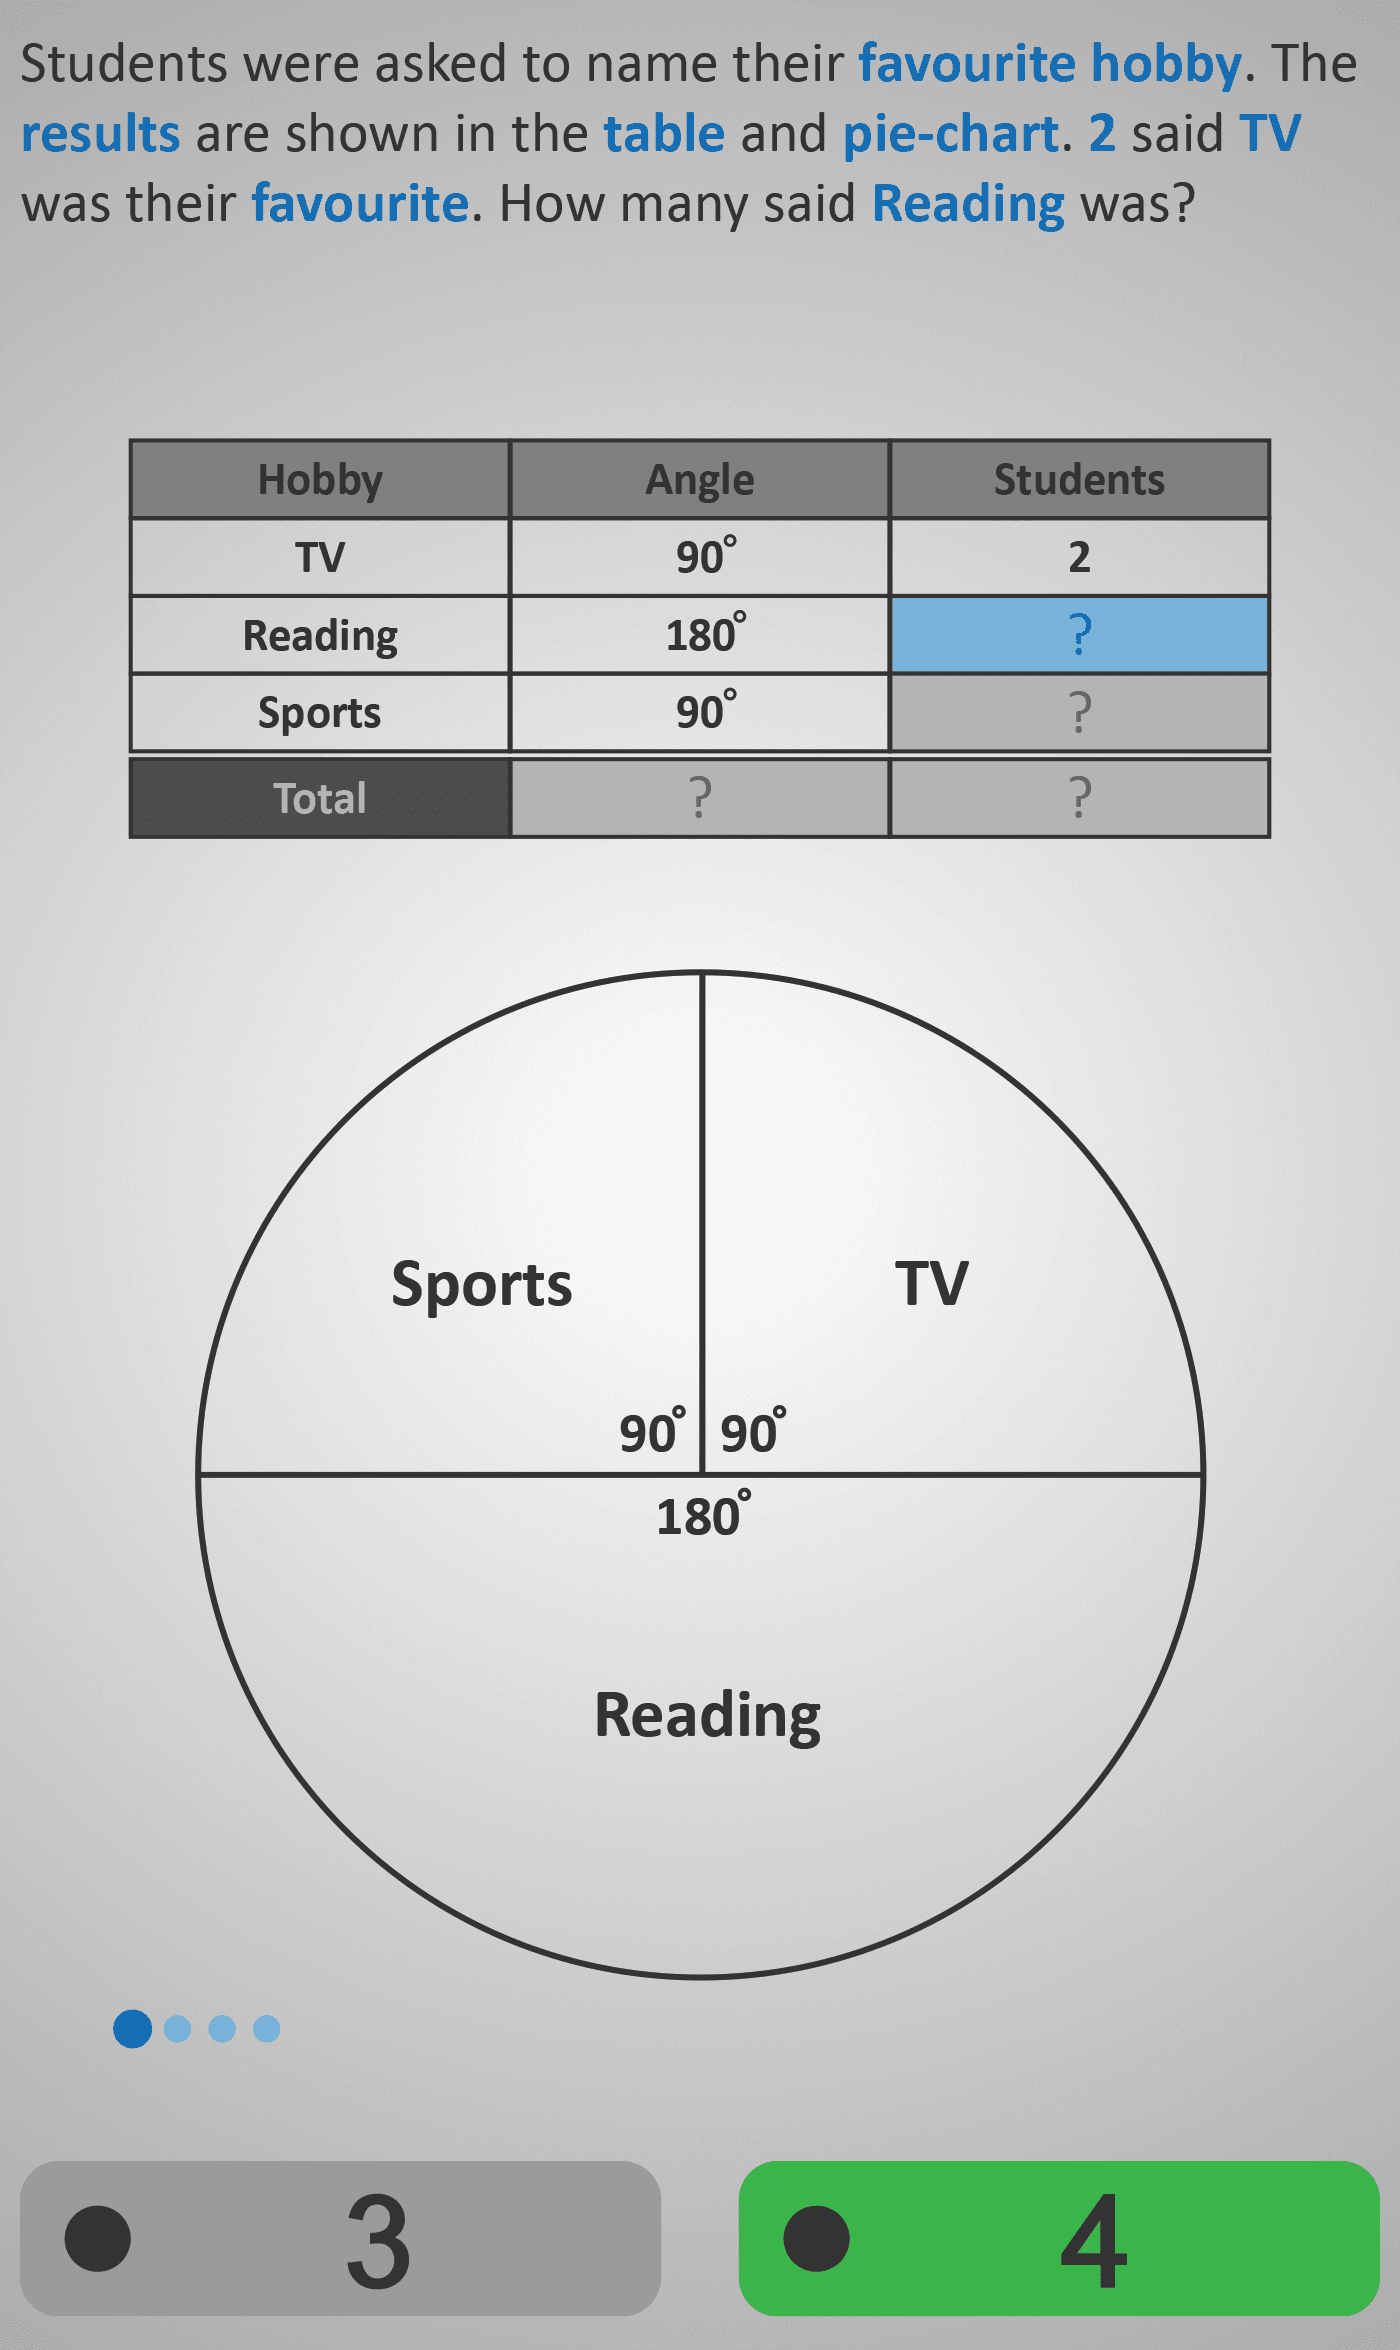
Students are shown a survey where classmates name their favourite hobby—TV, Reading, or Sports. The results are displayed in both a table and a pie chart, with given angles for each segment. Using the fact that a full circle measures 360°, students must determine how many students correspond to each angle.
The sequence begins by asking how many students chose Reading if 2 students chose TV (90° segment). Next, learners calculate how many selected Sports, before being guided to recognise that all angles in a pie chart must sum to 360°. The final step asks for the total number of students in the survey, requiring them to combine their earlier results.
This Phlow develops skills in:
- Proportion and ratio thinking (linking 90° → 2 students, scaling to other segments).
- Understanding pie charts (angles as fractions of a circle).
- Combining data from multiple representations (table + chart).
- Logical reasoning when interpreting real-world data.
By the end, students not only know how to read a pie chart but also how to use angle measures to calculate totals, reinforcing the connection between geometry and data handling.
Prerequisite Knowledge Required
- Awareness that a circle measures 360° in total.
- Basic understanding of pie charts as data representations (see Pie Chart 2A).
- Familiarity with interpreting simple tables and survey results.
- Knowledge of simple proportion and multiplication.
Main Category
Data and Statistics / Geometry
Estimated Completion Time
Approx 6-10 seconds per question. 20 questions total. Total time: 2-4 minute.
Cognitive Load / Step Size
Moderate — introduces two data formats (table + chart) but scaffolds clearly through one-to-one examples before combining representations. Step size is well controlled, supporting comprehension.
Language & Literacy Demand
Low to moderate — uses short, everyday terms (“TV,” “Reading,” “Sports”) and reinforces meaning visually through matching tables and pie charts.
Clarity & Design
Highly visual — the pie chart and table are aligned side by side, with angles clearly labelled. Colour-coding supports quick association between text and segments, enhancing interpretability.
Curriculum Alignment
Irish Junior Cycle Mathematics – Statistics Strand:
- “Interpret and represent data in multiple forms including tables, bar charts, and pie charts.”
Engagement & Motivation
High — real-world survey contexts (favourite hobbies) feel relatable and engaging. The step-by-step approach builds satisfaction through logical discovery rather than rote calculation.
Error Opportunities & Misconceptions
- Students may confuse the meaning of angles (thinking degrees = number of people).
- May forget that all angles sum to 360° — explicitly addressed through guided reasoning.
Transferability / Real-World Anchoring
Strong — reading and interpreting data from multiple formats is essential in school subjects, media, and everyday life. Reinforces real-world numeracy and data literacy.
Conceptual vs Procedural Balance
Balanced — learners develop conceptual understanding of proportions within a circle while practising procedural calculations with angles and totals.
Learning Objectives Addressed
- Interpret data from both tables and pie charts.
- Use 360° as the full-circle reference for calculating segment proportions.
- Apply proportional reasoning to find the number of items or people represented.
- Strengthen the link between geometry (angles) and statistics (data interpretation).
What Your Score Says About You
- Less than 5: Needs more practice linking angle measures to quantities.
- 6–7: Understands the basics but may overlook total or proportional reasoning.
- 8–9: Strong grasp of both representations with minor calculation slips.
- 10/10: Excellent — confidently connects tables, charts, and proportions across real contexts.