Pie Chart 2C
Overview
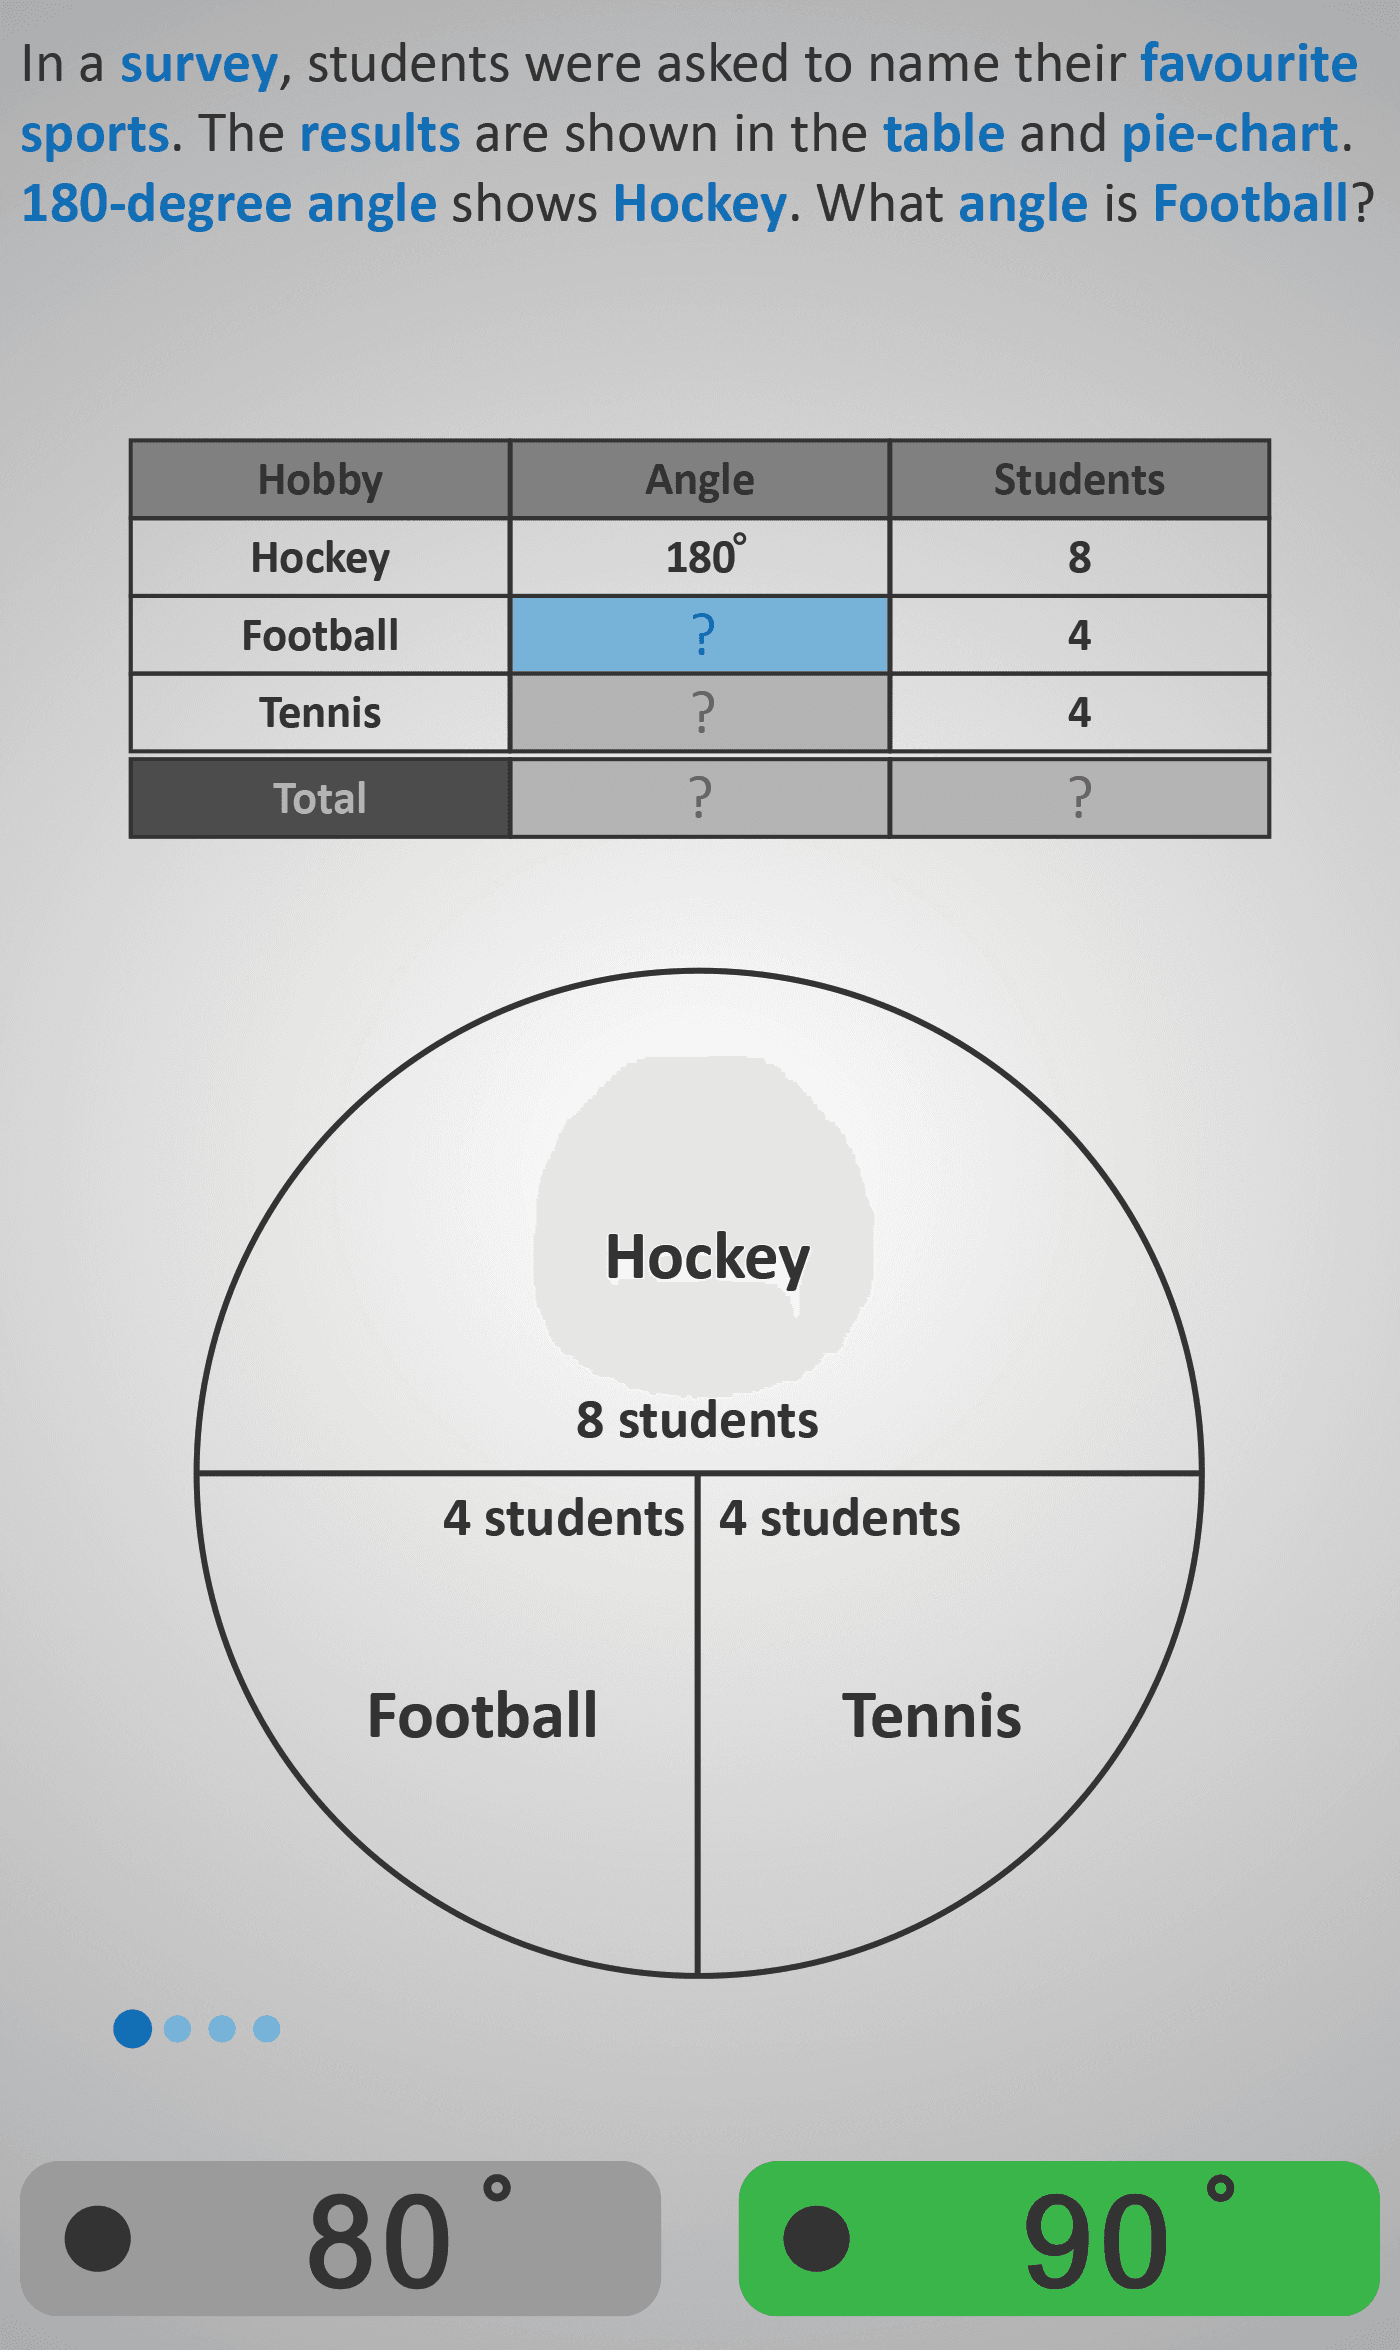
This Phlow builds on earlier pie chart exercises by introducing surveys with three categories and requiring students to calculate angles, student numbers, and totals.
Students are told that a 180° angle represents 8 students (Hockey). They must then work out the angle for Football and Tennis, each with 4 students. By recognising that half as many students should take up half the angle, learners identify that 90° represents 4 students. This introduces proportional reasoning between circle angles and category sizes.
In the next step, students confirm that Tennis also has a 90° slice, since it represents the same number of students as Football. The exercise then asks for the total number of students in the survey. Learners add 8 (Hockey) + 4 (Football) + 4 (Tennis) to get 16 students. Finally, they are asked the total degrees of all angles in a pie chart, consolidating their understanding that a circle equals 360°.
This sequence ensures learners:
- Link fractions of a circle to real-life data.
- Use proportional reasoning to scale angles correctly.
- Check their answers by working with both angles and student counts.
- Build fluency in moving between raw data, fractions, and graphical representation.
By the end, students have a solid grounding in how pie charts represent categorical data, preparing them for more complex surveys and percentage-based reasoning.
Prerequisite Knowledge Required
- Understanding that a circle measures 360° in total.
- Ability to interpret basic pie charts (see Pie Chart 2A and 2B).
- Familiarity with multiplication, division, and simple proportional reasoning.
Main Category
Data and Statistics / Geometry
Estimated Completion Time
Approx 6-10 seconds per question. 20 questions total. Total time: 2-4 minute.
Cognitive Load / Step Size
Moderate — introduces proportional relationships between angle size and data frequency. Each step builds logically, progressing from recognition (half as many → half the angle) to calculation (total angles and totals).
Language & Literacy Demand
Low — clear, everyday language (“Hockey,” “Football,” “Tennis”) with minimal text. The visuals carry the main reasoning load.
Clarity & Design
Strong — uses colour-coded segments and consistent labelling to visually link data, angles, and totals. The step-by-step structure supports comprehension without overwhelming learners.
Curriculum Alignment
Irish Junior Cycle Mathematics – Statistics Strand:
- “Interpret, analyse, and represent data using pie charts, connecting fractional parts of a whole to proportional measures.”
Engagement & Motivation
High — relatable survey topic (“favourite sport”) engages students, and the gradual reveal of data promotes curiosity and logical reasoning.
Error Opportunities & Misconceptions
- Assuming equal angles for unequal data values.
- Forgetting that all angles must sum to 360° — reinforced explicitly through guided correction.
Transferability / Real-World Anchoring
Strong — applicable to interpreting charts in everyday contexts such as surveys, reports, and media graphics. Connects geometric reasoning to data literacy.
Conceptual vs Procedural Balance
Balanced — students both understand why angles represent data and practise how to calculate them.
Learning Objectives Addressed
- Relate circle angles to proportional data values.
- Recognise that all pie chart angles sum to 360°.
- Use reasoning to scale data (e.g., half as many → half the angle).
- Strengthen links between geometry, fractions, and data representation.
What Your Score Says About You
- Less than 5: Needs to revisit how total angles (360°) relate to data sets.
- 6–7: Understands key concepts but may misjudge proportional scaling.
- 8–9: Accurately links data, angles, and totals with minor slips.
- 10/10: Confidently interprets and calculates all relationships between data and circle geometry.