Stem Leaf 2
Overview
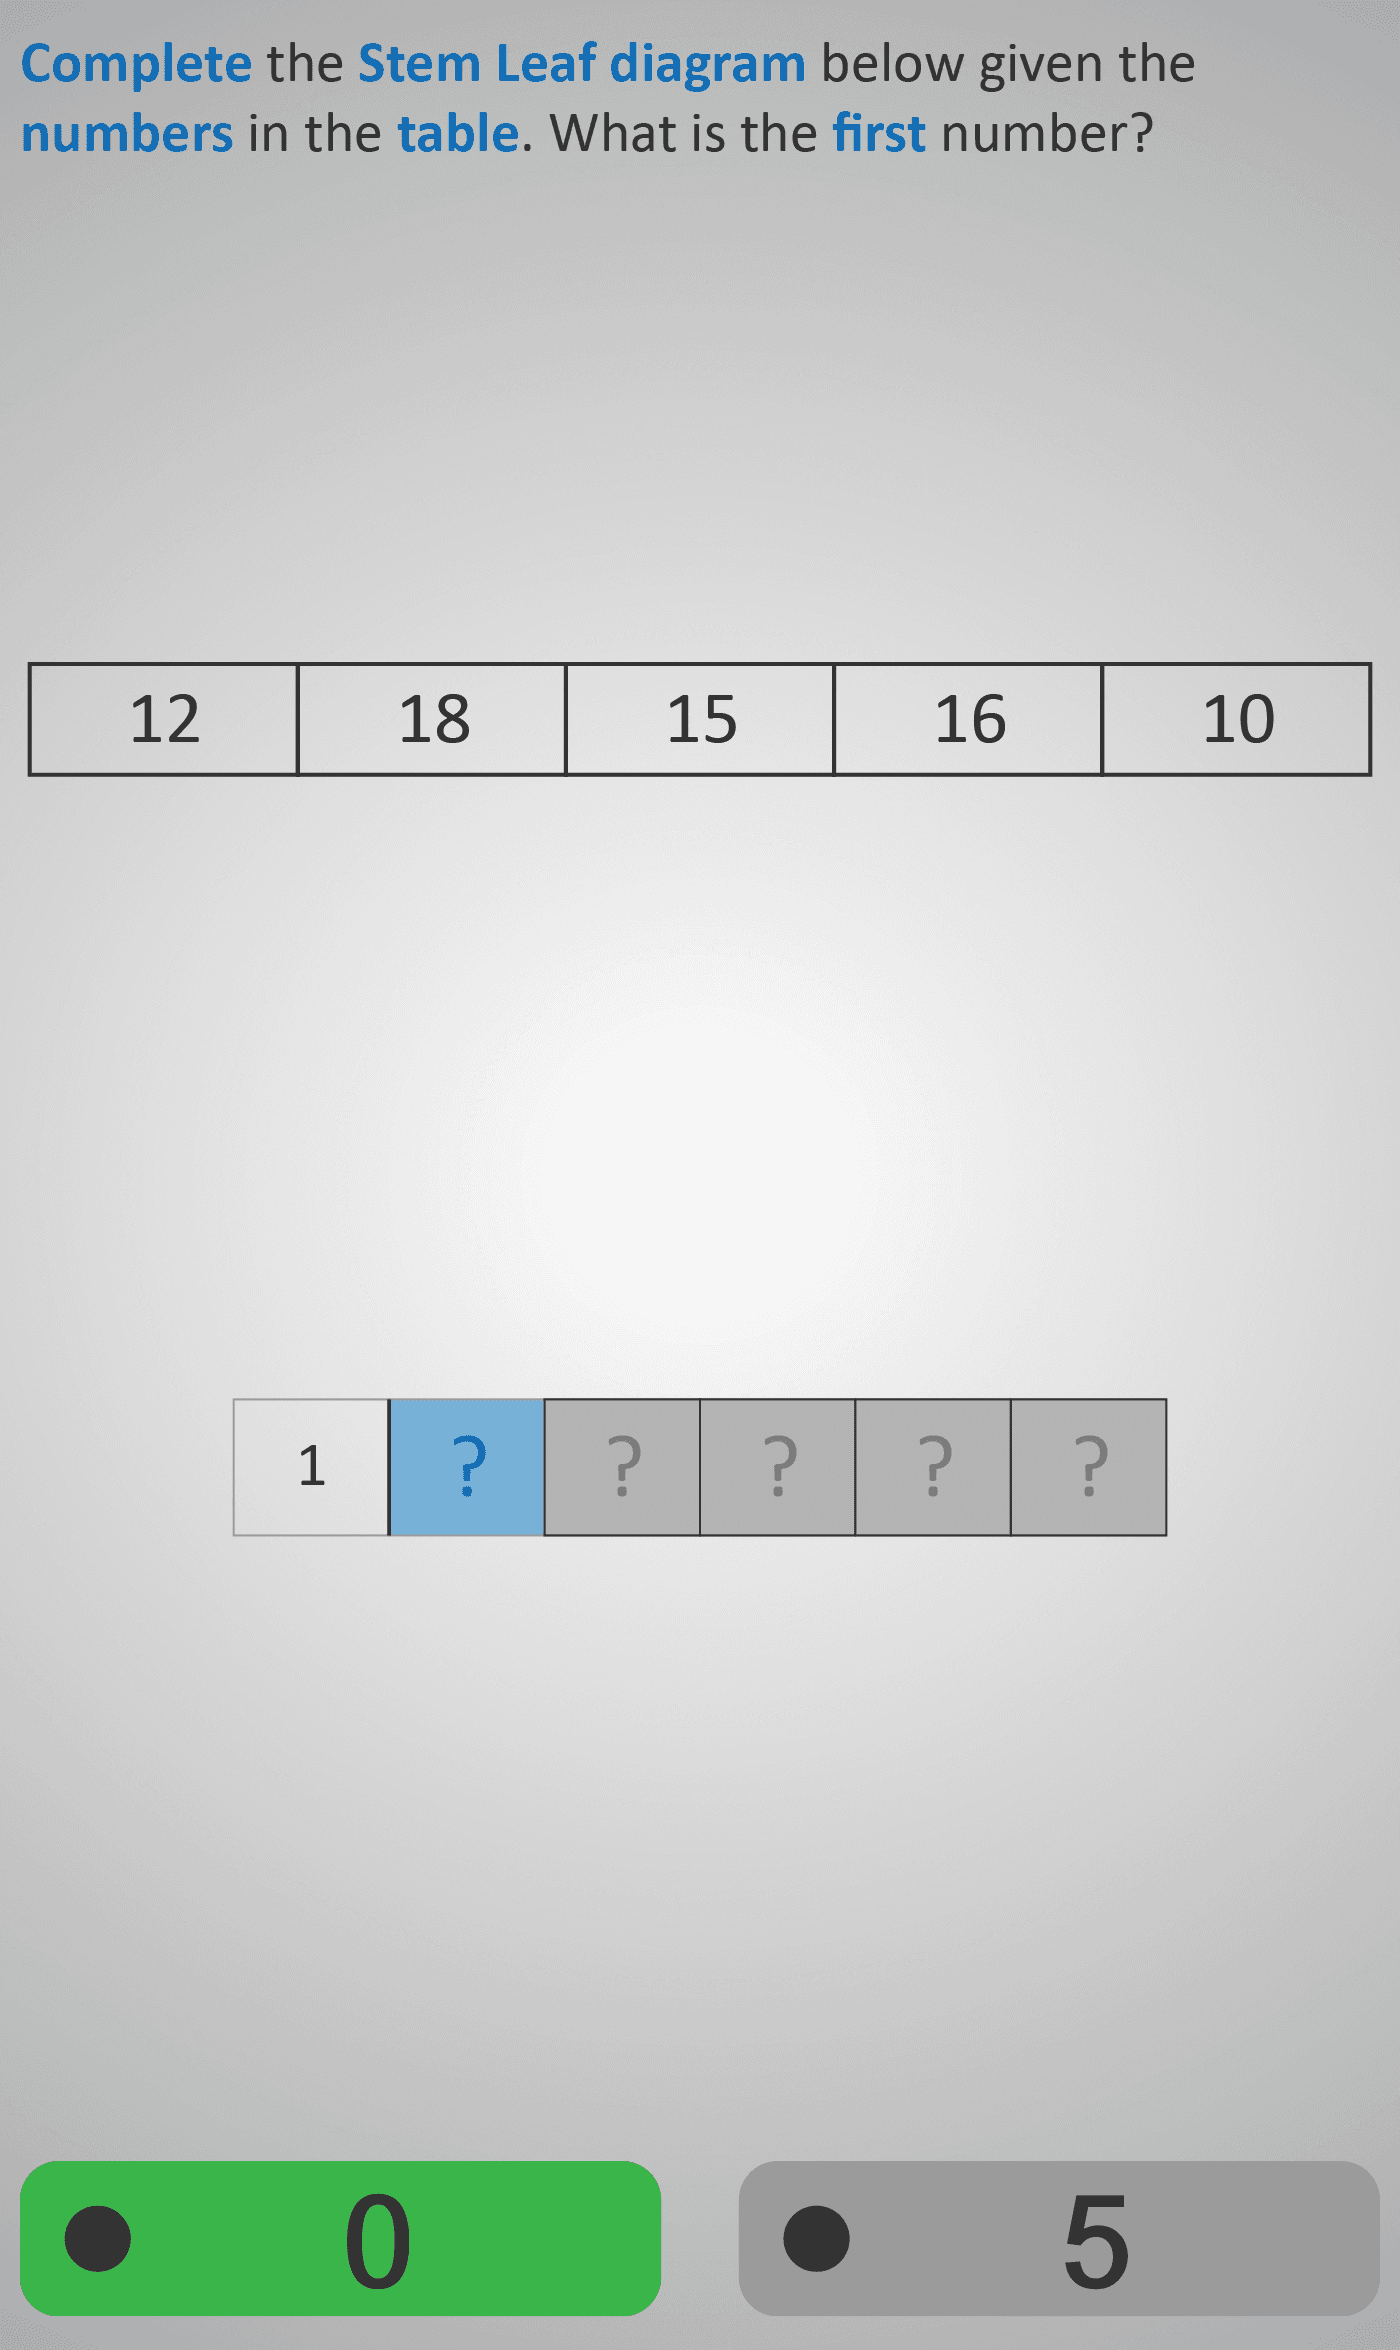
In this exercise, students learn how to construct a stem-and-leaf diagram step by step using a given set of numbers. The numbers provided are 12, 18, 15, 16, and 10.
The stem represents the tens digit (1), while the leaves represent the units digits of each number. Students are asked to place the correct digits into the diagram in ascending order.
First, the smallest number (10) is broken down into stem 1 and leaf 0. Next, the number 12 contributes a leaf of 2. Then, 15 is added as leaf 5, followed by 16 as leaf 6. Finally, 18 completes the diagram with a leaf of 8.
The completed diagram shows the data clearly organised as:
1 | 0 2 5 6 8
This task develops students’ skills in ordering data, understanding place value, and representing information visually. It also reinforces the importance of structuring data sets so patterns can be easily spotted.
Prerequisite Knowledge Required
- Linked Phlows: Stem Leaf 1 – interpreting simple stem-and-leaf diagrams.
- Numbers 2A – comparing and ordering numbers.
- Mean 2 / Median 2 – working with data sets and identifying key values.
Main Category
Data Handling – Representing and Organising Information
Estimated Completion Time
Approx 6–10 seconds per question. 20 questions total. Total time: 2–4 minutes.
Cognitive Load / Step Size
Low to Moderate — each step introduces one number at a time, making the data-building process clear and sequential. This gradual pacing supports conceptual understanding without overwhelming learners.
Language & Literacy Demand
Low — minimal text with visual examples of the diagram ensures accessibility. Key terms like stem and leaf are reinforced through context and visuals rather than long explanations.
Clarity & Design
Excellent — the stem-and-leaf layout is clean and visually structured. The process of adding each new number is clearly animated, helping students understand how data grows and is ordered in the diagram.
Curriculum Alignment
Irish Curriculum Strand: Data – Representing and Interpreting Data
- Represent data using an ordered stem-and-leaf diagram.
- Understand the role of tens and units in data grouping.
- Recognise patterns and distributions within data sets.
- Strengthen data-handling and organisation skills.
Engagement & Motivation
Moderate — the interactive, step-by-step build-up of the diagram feels rewarding as learners see the complete data set take shape. The visual satisfaction of creating order supports motivation and focus.
Error Opportunities & Misconceptions
- Confusing stems (tens) and leaves (units).
- Forgetting to order leaves numerically.
- Misplacing data points in the wrong stem row.
The guided sequence and visual checks minimise these risks by adding one value at a time.
Transferability / Real-World Anchoring
Strong — stem-and-leaf diagrams help learners summarise numerical data clearly, supporting later topics like averages, range, and data comparison. They also build habits of clear, ordered data presentation.
Conceptual vs Procedural Balance
Balanced — the Phlow builds conceptual understanding of how data is grouped by place value, while also reinforcing procedural fluency in constructing diagrams correctly and neatly.
Learning Objectives Addressed
- Identify stems and leaves within numerical data.
- Organise data systematically in ascending order.
- Construct a complete stem-and-leaf diagram.
- Interpret how ordered data reveals patterns or trends.
What Your Score Says About You
- Less than 5: Needs more practice distinguishing stems and leaves or ordering correctly.
- 6–7: Understands the process but may make small placement errors.
- 8–9: Can accurately build and read stem-and-leaf diagrams.
- 10 / 10: Excellent mastery — fully understands data organisation and visual representation.