Survey 2B
Overview
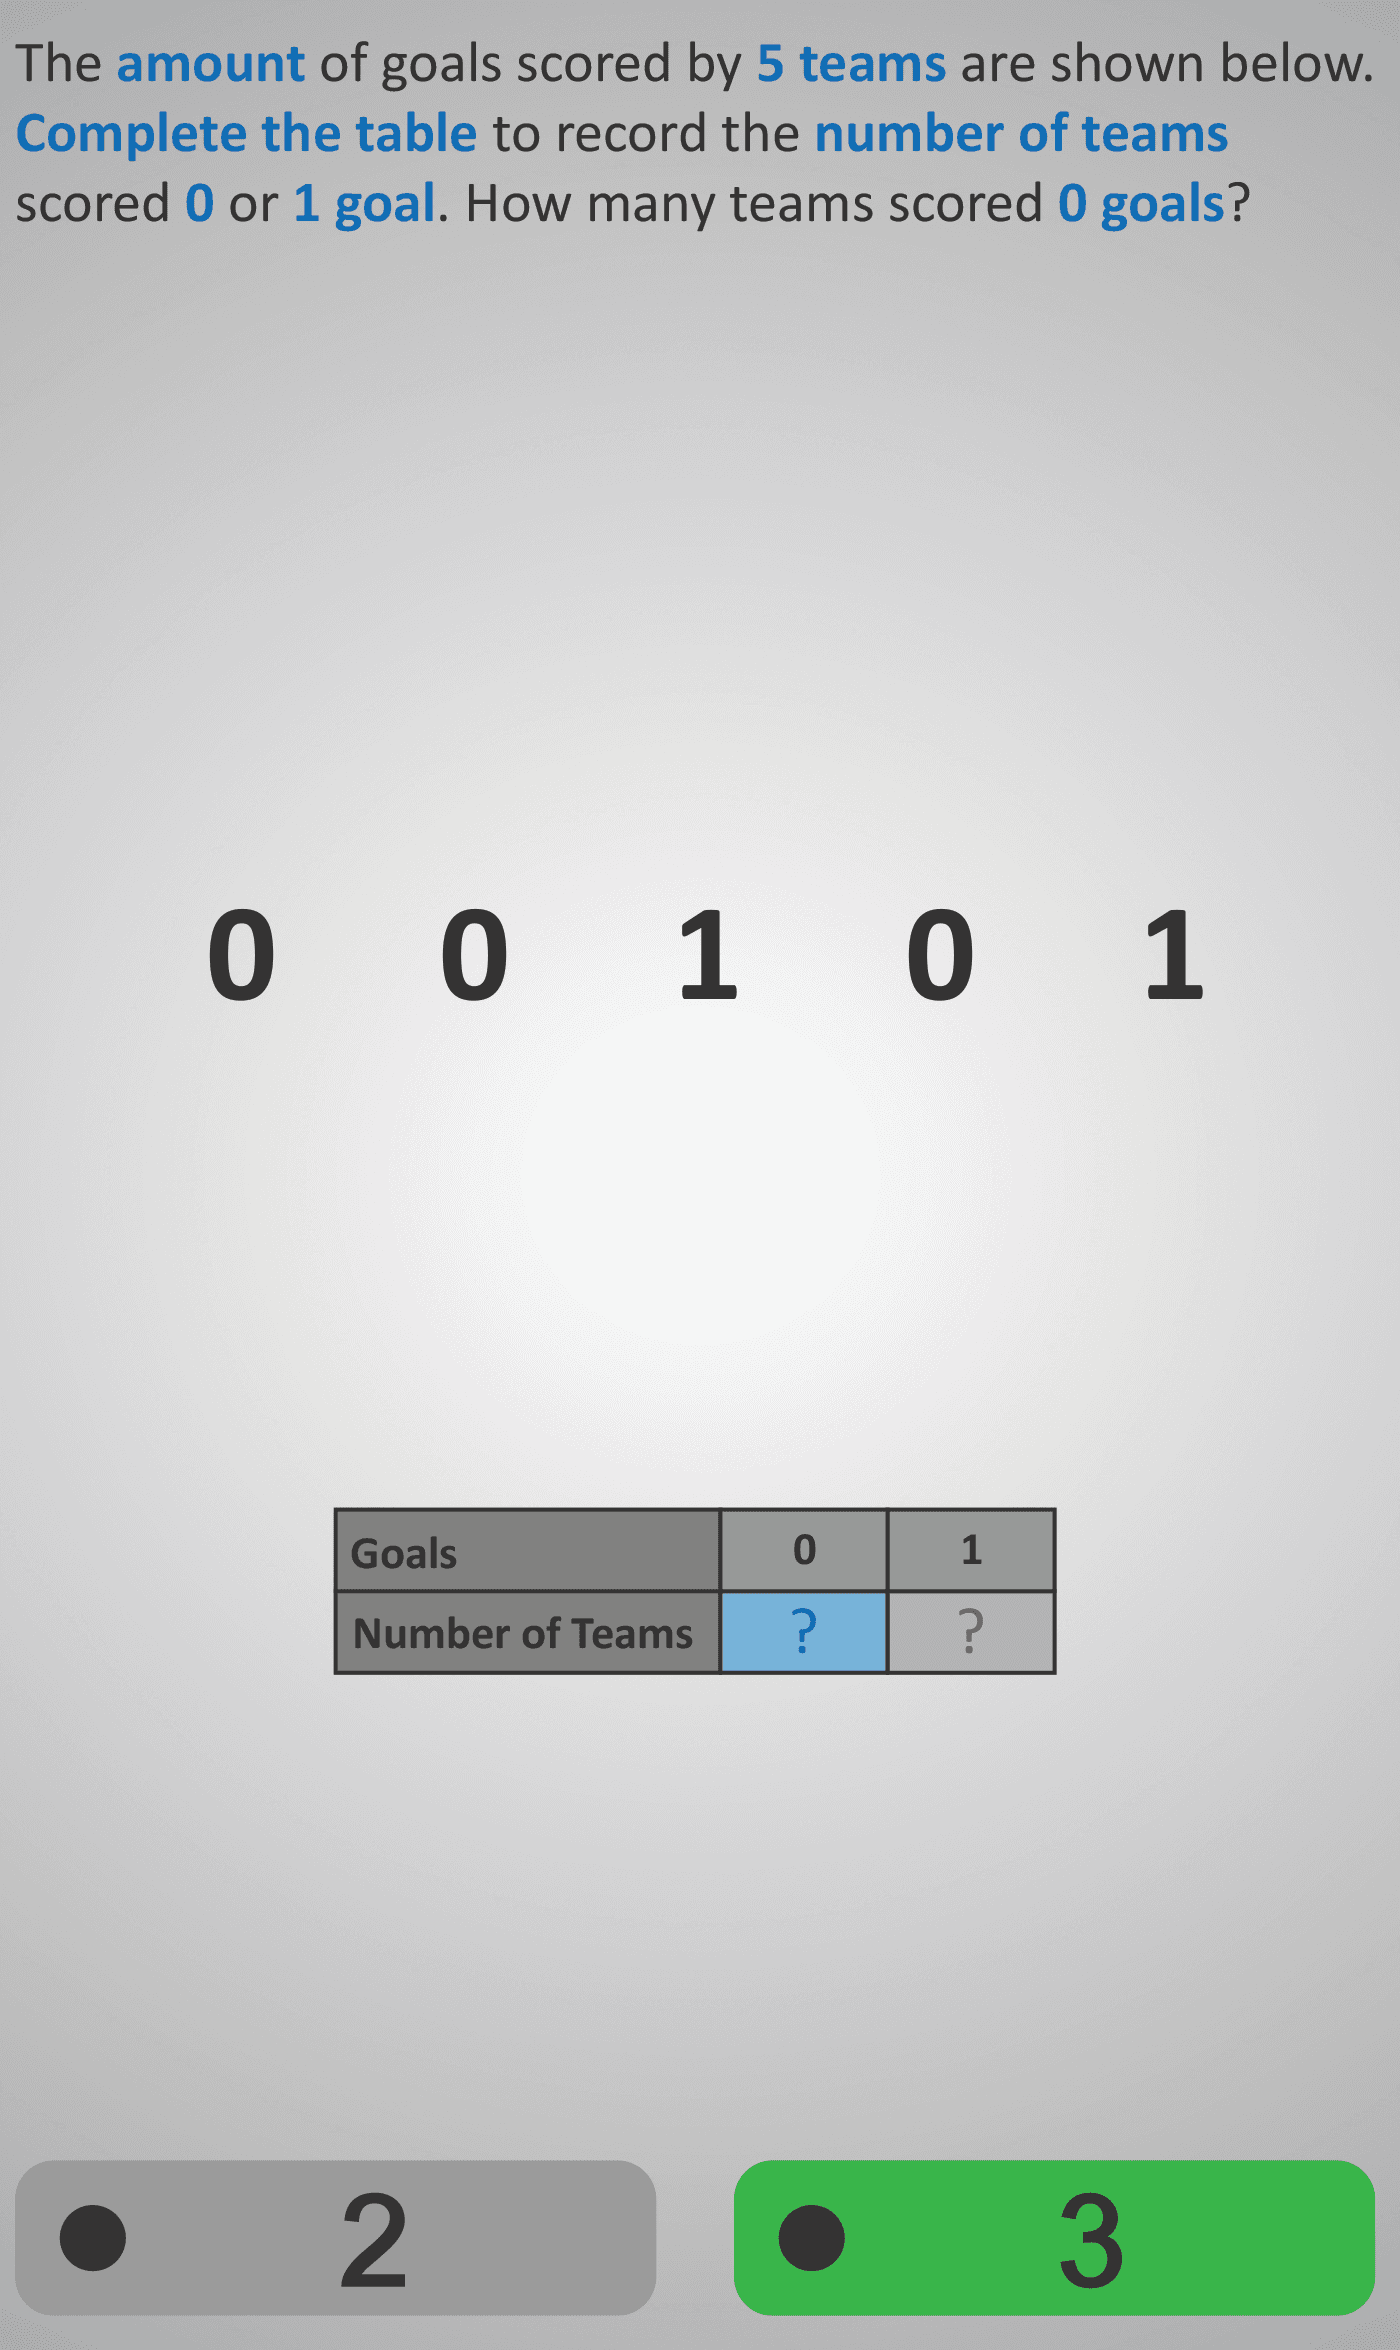
In this exercise, students practise how to complete a frequency table using results from a small dataset. The context is football teams scoring goals.
Step 1: Students see the goals scored by 5 teams (e.g., 0, 0, 1, 0, 1). They must count how many teams scored 0 goals and record this in the table.
Step 2: They then do the same for 1 goal, finishing the table for this dataset.
Step 3: A second dataset is shown (e.g., 2, 3, 2, 3, 2). Students must complete the table again, first recording the number of teams that scored 2 goals, and then those that scored 3 goals.
This sequence builds skills in data handling, tallying, and interpreting results. By working step by step, learners develop confidence in turning raw data into organised information using tables.
Prerequisite Knowledge Required
- Linked Phlows: Survey 1 – understanding simple data collection and tally marks.
- Survey 2A – interpreting survey results through bar charts.
- Numbers 2A – comparing small whole numbers.
Main Category
Data Handling – Recording and Organising Information
Estimated Completion Time
Approx 6–10 seconds per question. 20 questions total. Total time: 2–4 minutes.
Cognitive Load / Step Size
Low — the task isolates one concept per screen (counting 0s, then 1s, then 2s, etc.), reducing mental load. The repetition across small datasets supports pattern recognition and strengthens data organisation fluency.
Language & Literacy Demand
Low — clear, concise wording with strong visual scaffolding (tables and scores displayed). Focus remains on numerical recognition rather than text comprehension, making it accessible for a wide range of learners.
Clarity & Design
Excellent — the layout of raw scores above and the empty table below visually connects counting to recording. Alternating colours or clear borders help guide attention to where numbers should be placed.
Curriculum Alignment
Irish Curriculum Strand: Data – Representing and Interpreting Data
- Collect, record, and represent data using tables and tallies.
- Identify frequencies of results in small data sets.
- Understand how organised tables support data analysis.
- Lay foundations for constructing bar charts and pictograms.
Engagement & Motivation
Moderate to High — the football theme feels familiar and relevant. Students enjoy the tangible link between real-world scenarios (goals scored) and data representation. The step-by-step format adds structure and satisfaction as the table fills in.
Error Opportunities & Misconceptions
- Miscounting repeated values (especially when visually scanning lists).
- Confusing frequency with value (e.g., writing 0 instead of the count of 0s).
- Skipping a row in the table or misaligning counts.
The gradual structure and visual prompts minimise these risks and encourage checking work.
Transferability / Real-World Anchoring
Strong — skills apply directly to classroom surveys, sports results, and other count-based datasets. This foundational skill supports interpreting charts, averages, and probability in later Phlows.
Conceptual vs Procedural Balance
Balanced — the activity reinforces conceptual understanding of what frequency means while practising the procedure of systematically counting and recording data.
Learning Objectives Addressed
- Count and record the frequency of outcomes in a dataset.
- Use a frequency table to organise raw data.
- Identify patterns and totals from structured data.
- Develop foundational data-handling and interpretation skills.
What Your Score Says About You
- Less than 5: Needs more practice distinguishing between values and frequencies.
- 6–7: Understands table setup but may make small counting errors.
- 8–9: Accurately records and interprets data in tables.
- 10 / 10: Excellent mastery — confidently collects, counts, and records data systematically.