Venn Dia 2B
Overview
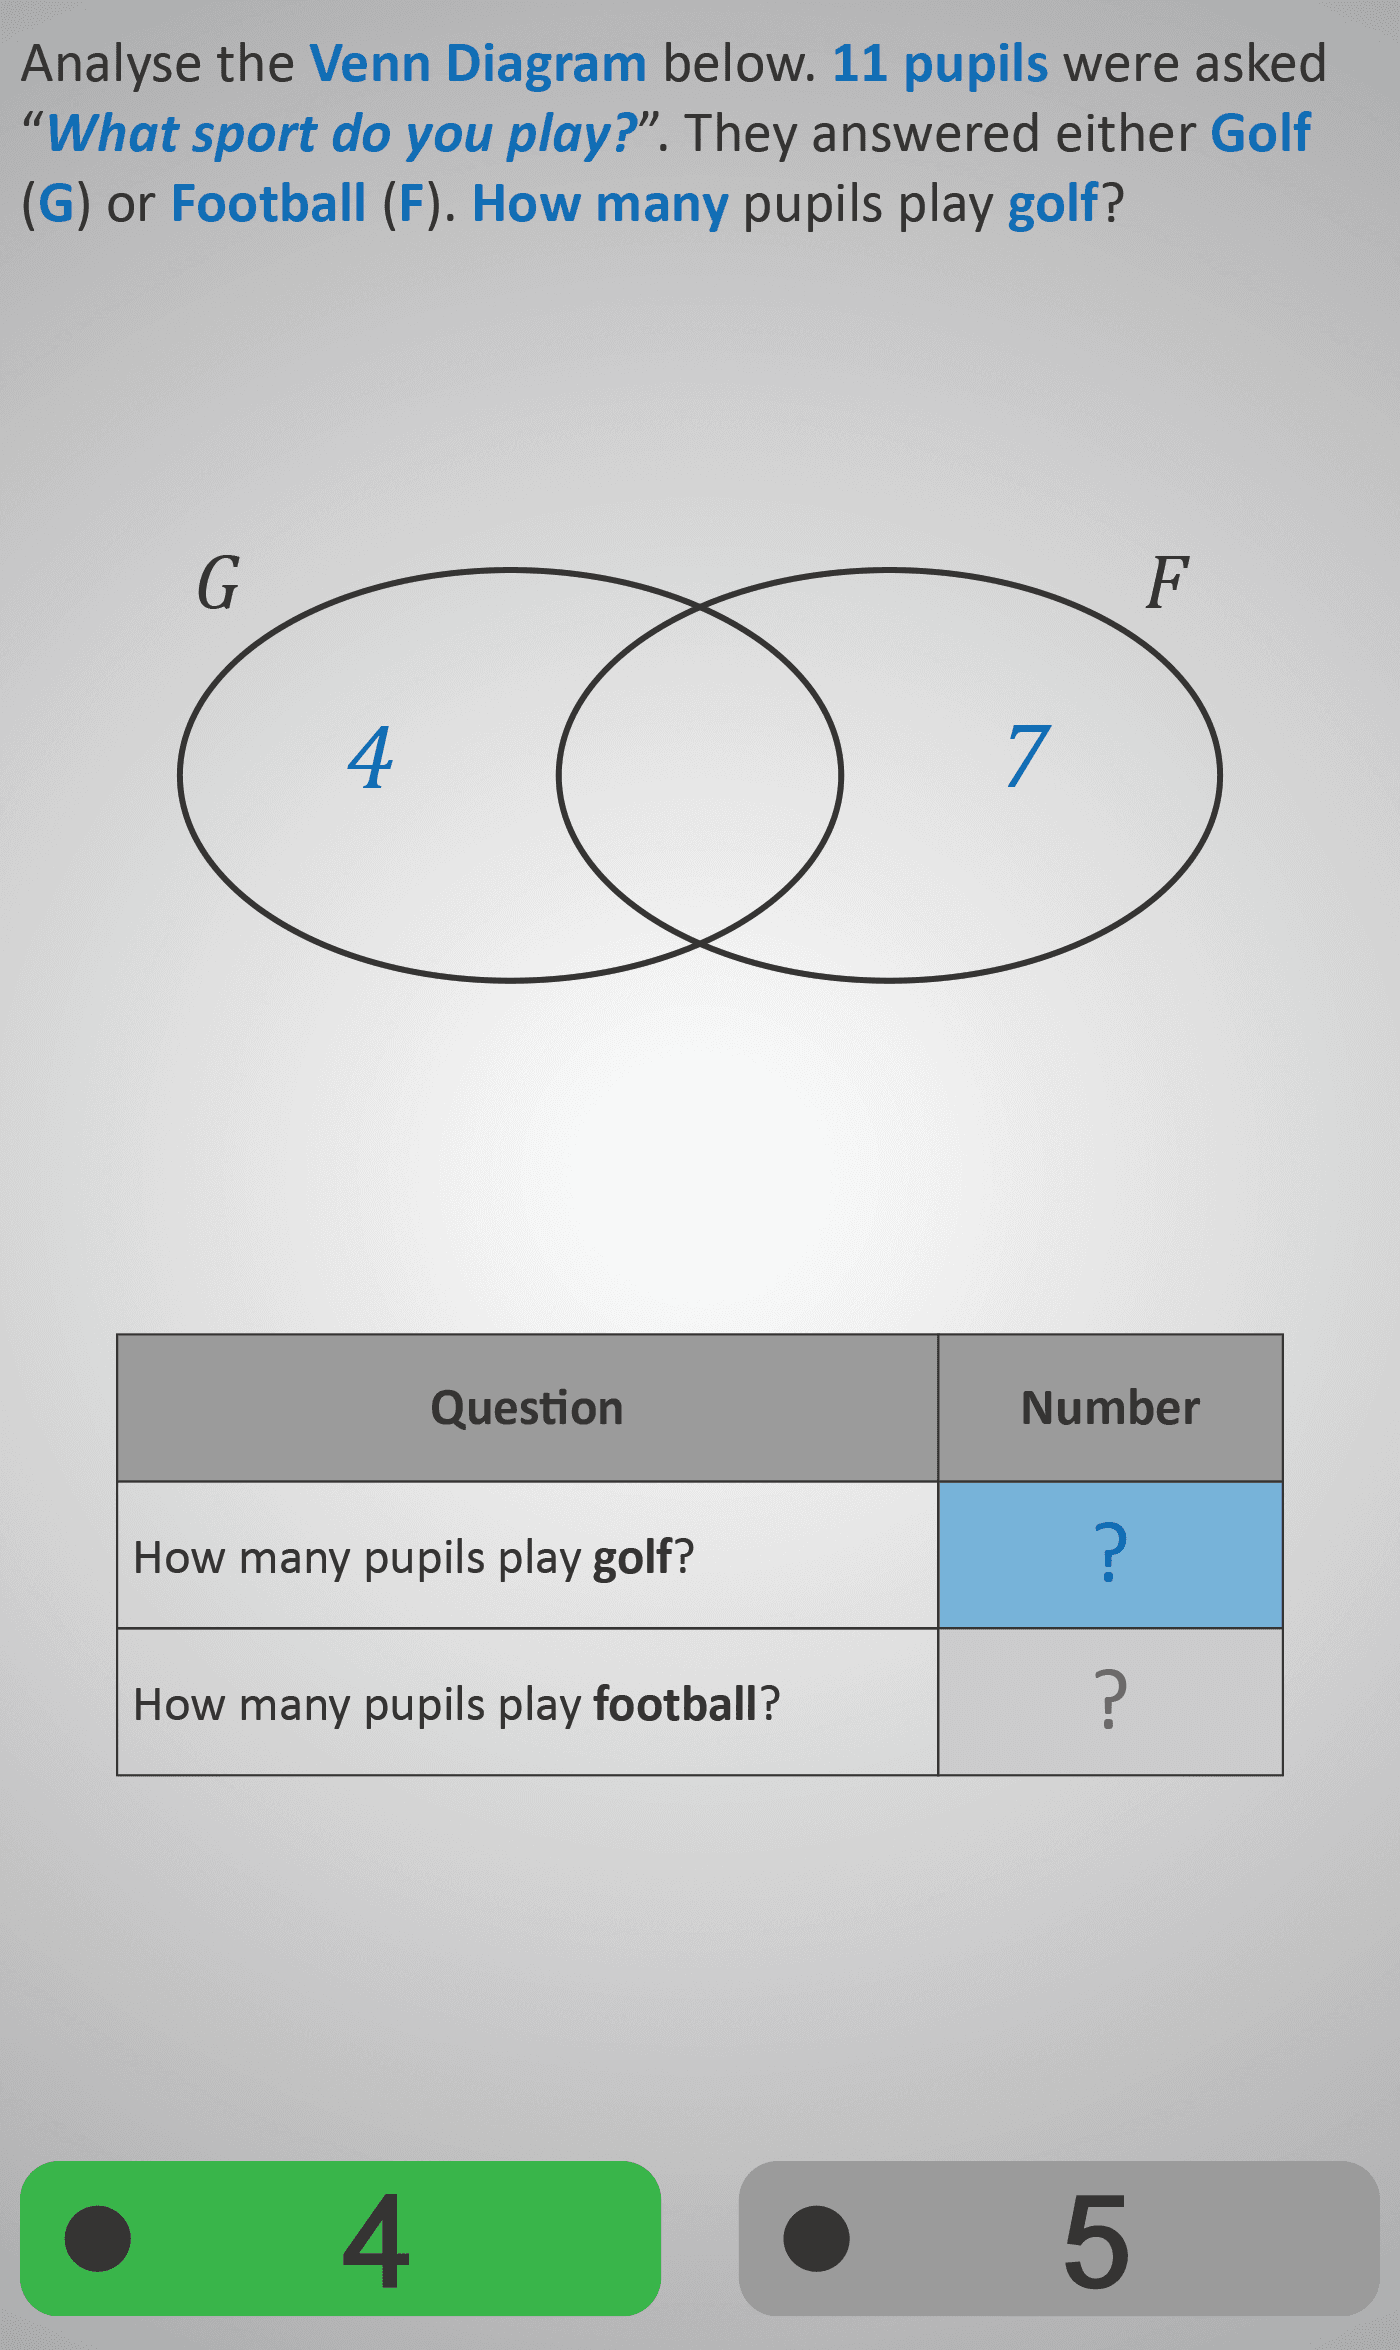
This exercise develops students’ understanding of Venn diagrams in the context of real-world survey data. Pupils are presented with scenarios where groups of students have been asked about their preferences or activities, such as which sport they play (golf or football) or which day they prefer (Thursday or Friday).
The Venn diagrams are partially filled with numbers representing the number of students in each category. Students must carefully read the diagrams and determine how many belong to each set. The follow-up questions guide learners to extract the values directly from the diagram and complete the table below, showing the number of pupils in each group.
Answer choices are provided in multiple-choice format, with the correct responses highlighted to support self-checking. This activity strengthens skills in:
- Interpreting Venn diagrams.
- Connecting visual set representations with numerical data.
- Applying logical reasoning to real-world contexts.
By using familiar contexts (sports, days of the week), the task makes abstract set theory more engaging and accessible.
Prerequisite Knowledge Required
- Linked Phlows: Venn Dia 2A – identifying which numbers belong to specific sets.
- Sets 2 – writing and listing elements in sets.
- Numbers 2A / 2B – comparing and organising small numbers.
- Survey 2B – recording data in tables.
Main Category
Data & Probability – Interpreting Sets and Surveys
Estimated Completion Time
Approx 6–10 seconds per question. 20 questions total. Total time: 2–4 minutes.
Cognitive Load / Step Size
Moderate — students transition from symbolic set recognition to numerical interpretation. The step increase is manageable due to supportive visuals and familiar everyday contexts (sports, days).
Language & Literacy Demand
Moderate — short question sentences combined with clear visual diagrams minimise reading barriers. Some words (e.g., “survey,” “pupils,” “groups”) may need clarification for younger learners but are supported by visual context.
Clarity & Design
Strong — diagrams are clean, colour-coded, and labelled clearly with numbers or categories. Overlaps are visually distinct, helping students focus on intersections and exclusive groups. The accompanying tables reinforce organisation of numerical data.
Curriculum Alignment
Irish Curriculum Strand: Data and Chance – Representing and Interpreting Data
- Read and interpret information from Venn diagrams.
- Translate data between graphical (Venn) and tabular (table) formats.
- Apply counting and logical reasoning to real-life data.
- Understand intersections, unions, and exclusive groupings.
Engagement & Motivation
High — relatable contexts like sports and days of the week help connect set theory to everyday life. The survey-based approach encourages curiosity and reinforces the social aspect of data interpretation.
Error Opportunities & Misconceptions
- Misreading numbers in overlapping sections.
- Confusing totals with subset values.
- Double-counting elements in both sets.
- Interpreting blank spaces as zero rather than “not shown.”
The step-by-step layout and visual cues help reduce these common errors.
Transferability / Real-World Anchoring
Strong — connects abstract set concepts to real-world data organisation (e.g., school surveys, opinion polls, sports stats). Reinforces reasoning skills needed for probability and data analysis in later stages.
Conceptual vs Procedural Balance
Conceptual — focuses on understanding what the numbers in each region represent rather than performing new calculations. Encourages logical reading of diagrams before applying formulas in later levels.
Learning Objectives Addressed
- Interpret real-life data displayed in Venn diagrams.
- Identify overlaps, separate groups, and totals within sets.
- Transfer numerical information into a table format.
- Strengthen understanding of how sets represent relationships in data.
What Your Score Says About You
- Less than 5: Needs more practice distinguishing between overlapping and non-overlapping data.
- 6–7: Understands the layout of Venn diagrams but may misread totals or intersections.
- 8–9: Accurately interprets most diagrams and tables.
- 10 / 10: Excellent mastery — confidently connects real-world data to visual set representations.