Visual Algebra 2B
Overview
Introduces learners to algebraic expressions involving addition in a visual and interactive way.
Building Expressions with Symbols
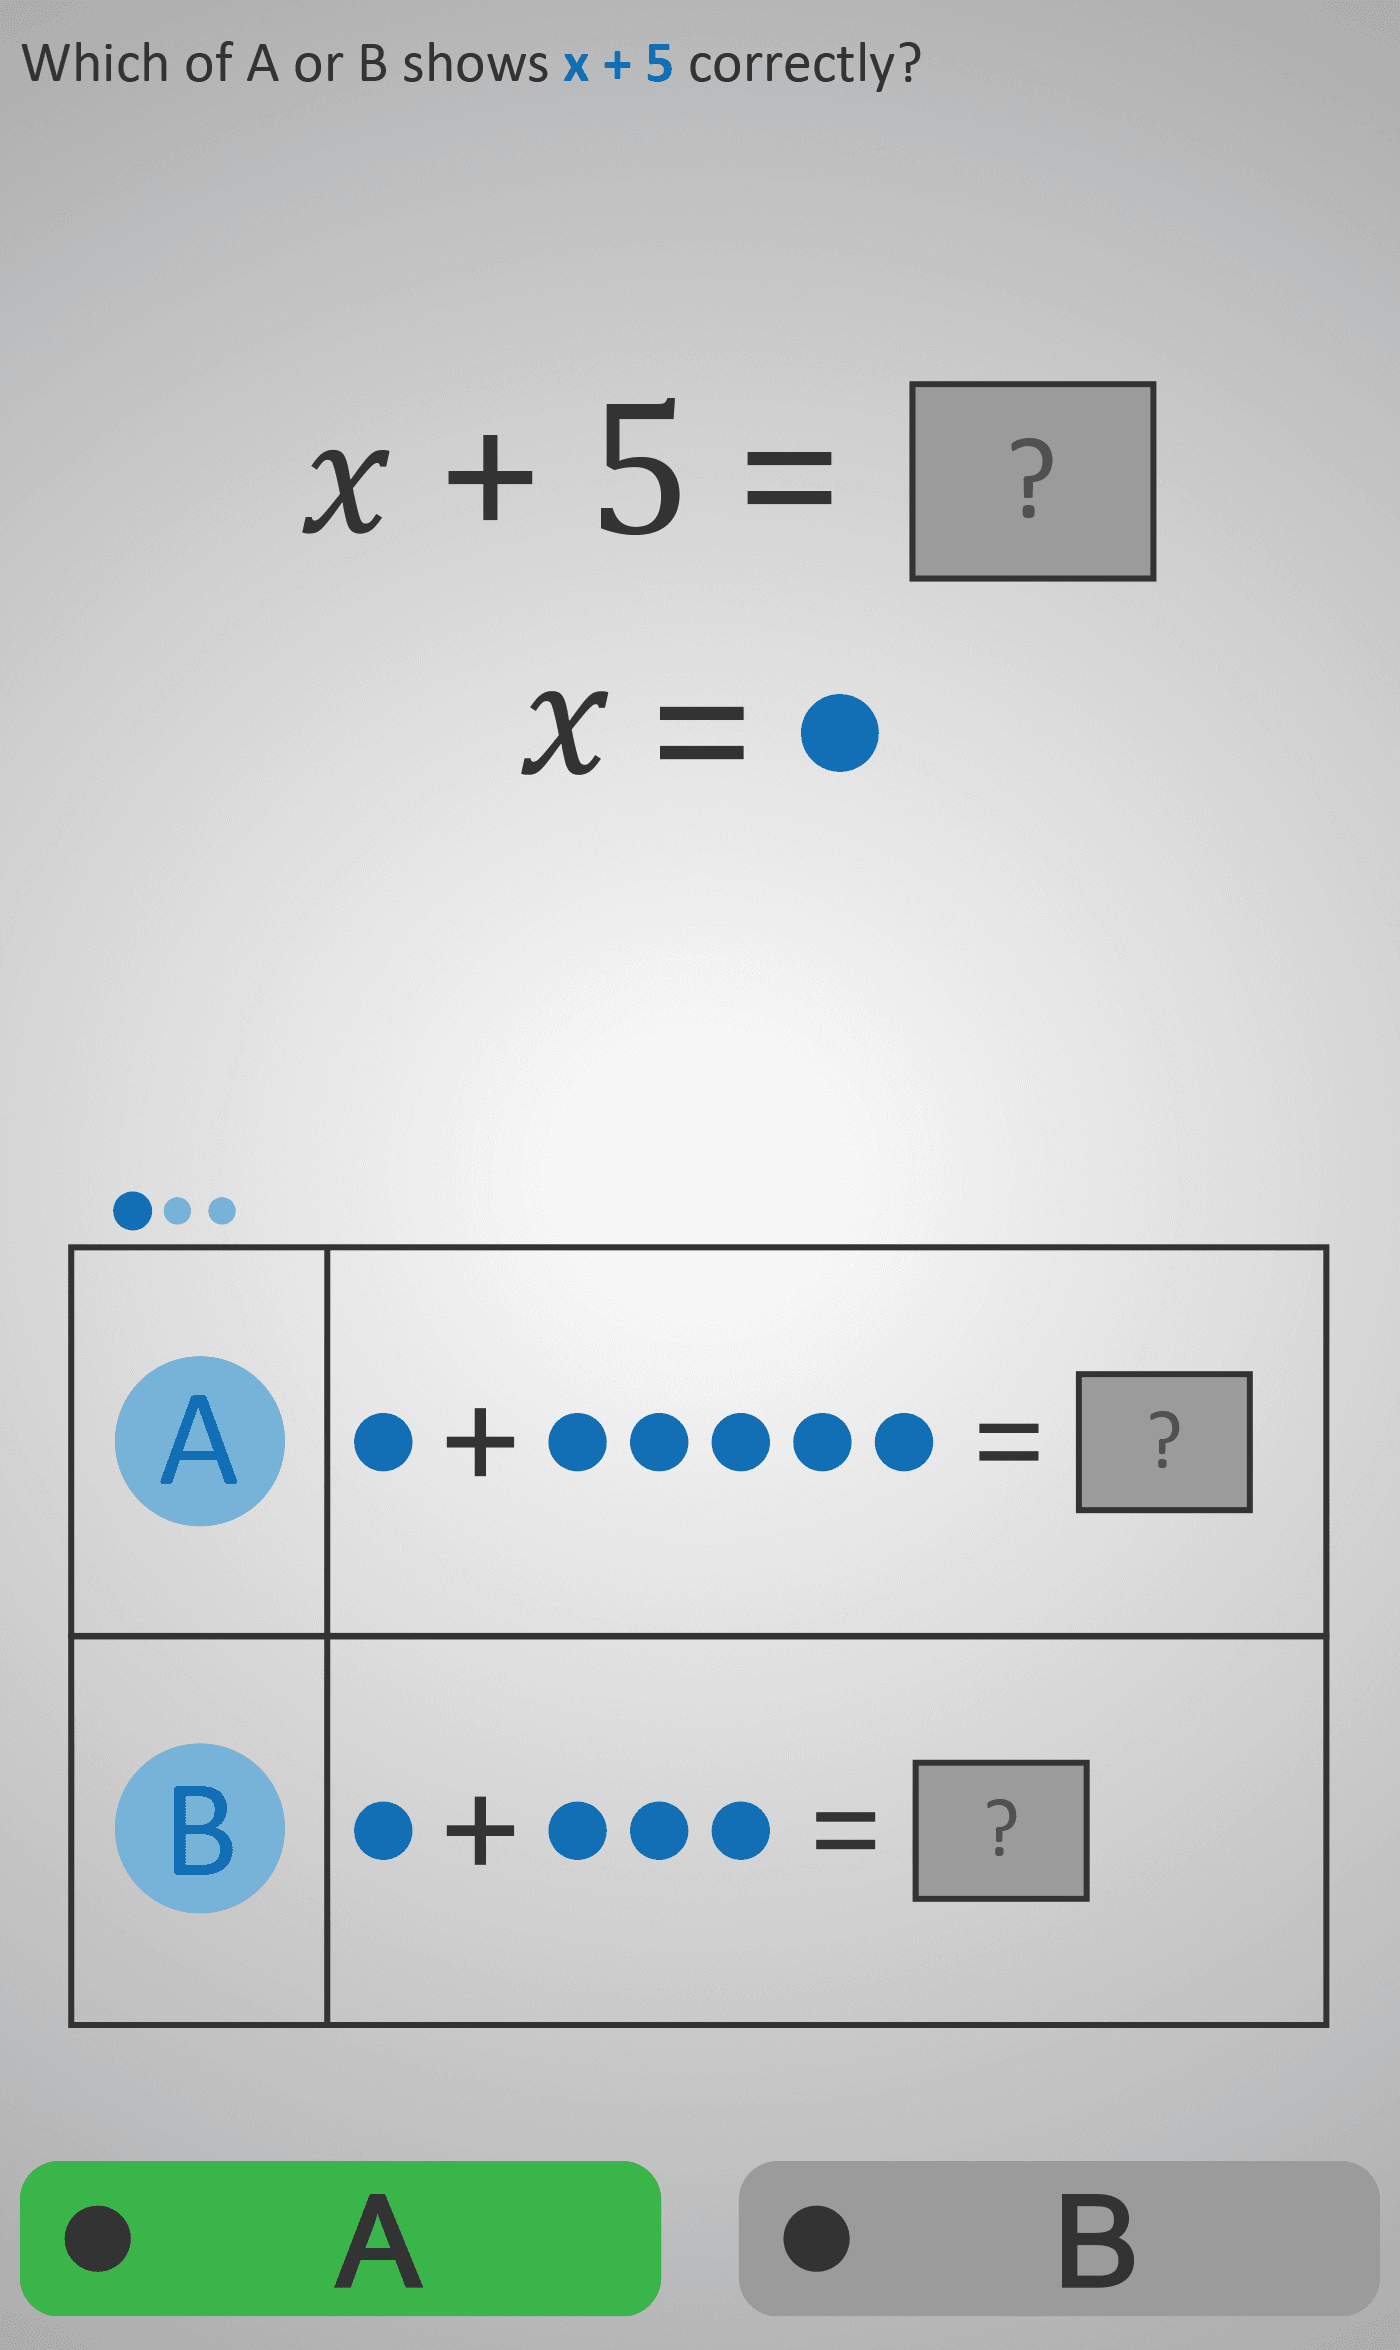
Students are shown an algebraic form like x + 5, with x represented by a single blue circle. They must choose between two visual models to identify which one correctly represents x + 5. This encourages understanding of how a variable combines with a constant.
From Variables to Numbers
The expression is then grounded in numbers by setting x = 1 (one circle). Students calculate x + 5 as 1 + 5, represented with circles. They compare visual options (e.g., five circles vs. six circles) to determine the correct result.
Confirming the Answer
The final step asks explicitly: “What is the value of 1 + 5?” Learners count and confirm that the total is 6, reinforcing both the arithmetic and its algebraic representation.
This sequence bridges abstract algebra and concrete counting, helping students grasp how variables work in addition problems. It builds fluency by combining symbolic notation (x + 5) with visual models, making early algebra both accessible and engaging.
Prerequisite Knowledge Required
- Linked Phlows: Visual Algebra 2A – multiplying variables by numbers using visual models.
- Add 1 / Add 2 – understanding addition as combining quantities.
- Algebra 1A–1C – recognising variables and constants in expressions.
- Analyse 2A – identifying visual patterns and quantities.
Main Category
Algebra – Visual Representations and Expression Building
Estimated Completion Time
Approx 6–10 seconds per question. 20 questions total. Total time: 2–4 minutes.
Cognitive Load / Step Size
Low to Moderate — each screen introduces one new concept (adding a constant to a variable) with clear visual supports. The use of circles reduces abstraction, ensuring smooth progression from counting to symbolic reasoning.
Language & Literacy Demand
Low — questions use short, direct prompts such as “Which model shows x + 5?” Supported visuals reduce reading demand, allowing learners to focus on interpreting symbols and images rather than long text.
Clarity & Design
Excellent — minimal, colour-coded graphics (blue for variables, neutral for constants) clearly link symbols to visual meaning. Simple layouts prevent distraction and support quick comprehension of the algebra-visual connection.
Curriculum Alignment
Irish Curriculum Strand: Algebra – Representing Patterns and Relationships
- Represent and interpret algebraic expressions visually.
- Recognise the relationship between symbols (x + 5) and concrete quantities.
- Evaluate expressions by substituting numerical values.
- Strengthen understanding of how variables and constants combine.
Engagement & Motivation
High — visual circles and interactive comparisons make abstract algebra accessible. The task design feels exploratory rather than procedural, appealing to visual and tactile learners while reducing anxiety around algebra.
Error Opportunities & Misconceptions
- Miscounting total objects when combining variable and constant.
- Treating x and 5 as separate unrelated quantities rather than additive.
- Confusing substitution (x = 1) with multiplication (5x).
The Phlow’s step-by-step structure and alternating visual-symbolic checks address these risks directly.
Transferability / Real-World Anchoring
Moderate — the algebra-visual bridge supports transfer to later topics like equations, substitution, and area models. It develops pattern recognition skills useful in reasoning about relationships in formulas or data.
Conceptual vs Procedural Balance
Conceptual — prioritises understanding why variable addition works through visual reasoning before introducing formal algebraic manipulation. It lays the foundation for procedural fluency later.
Learning Objectives Addressed
- Understand that variables can be combined with constants through addition.
- Translate between visual and symbolic forms of algebraic expressions.
- Practise substituting values into expressions and evaluating results.
- Build fluency in reading and reasoning about algebraic structure.
What Your Score Says About You
- Less than 5: Needs more practice connecting symbols to visual quantities.
- 6–7: Understands the basics of addition with variables but may confuse visual and symbolic representations.
- 8–9: Interprets visual algebra expressions accurately and substitutes values correctly.
- 10 / 10: Excellent mastery — confidently links abstract notation to visual meaning and arithmetic results.