Analyse 3A
Overview
Introduces students to the fundamentals of data handling — observing, counting, and organising information systematically. Using a simple and visually engaging set of coloured circles, learners build the connection between what they see and how they record it in a table.
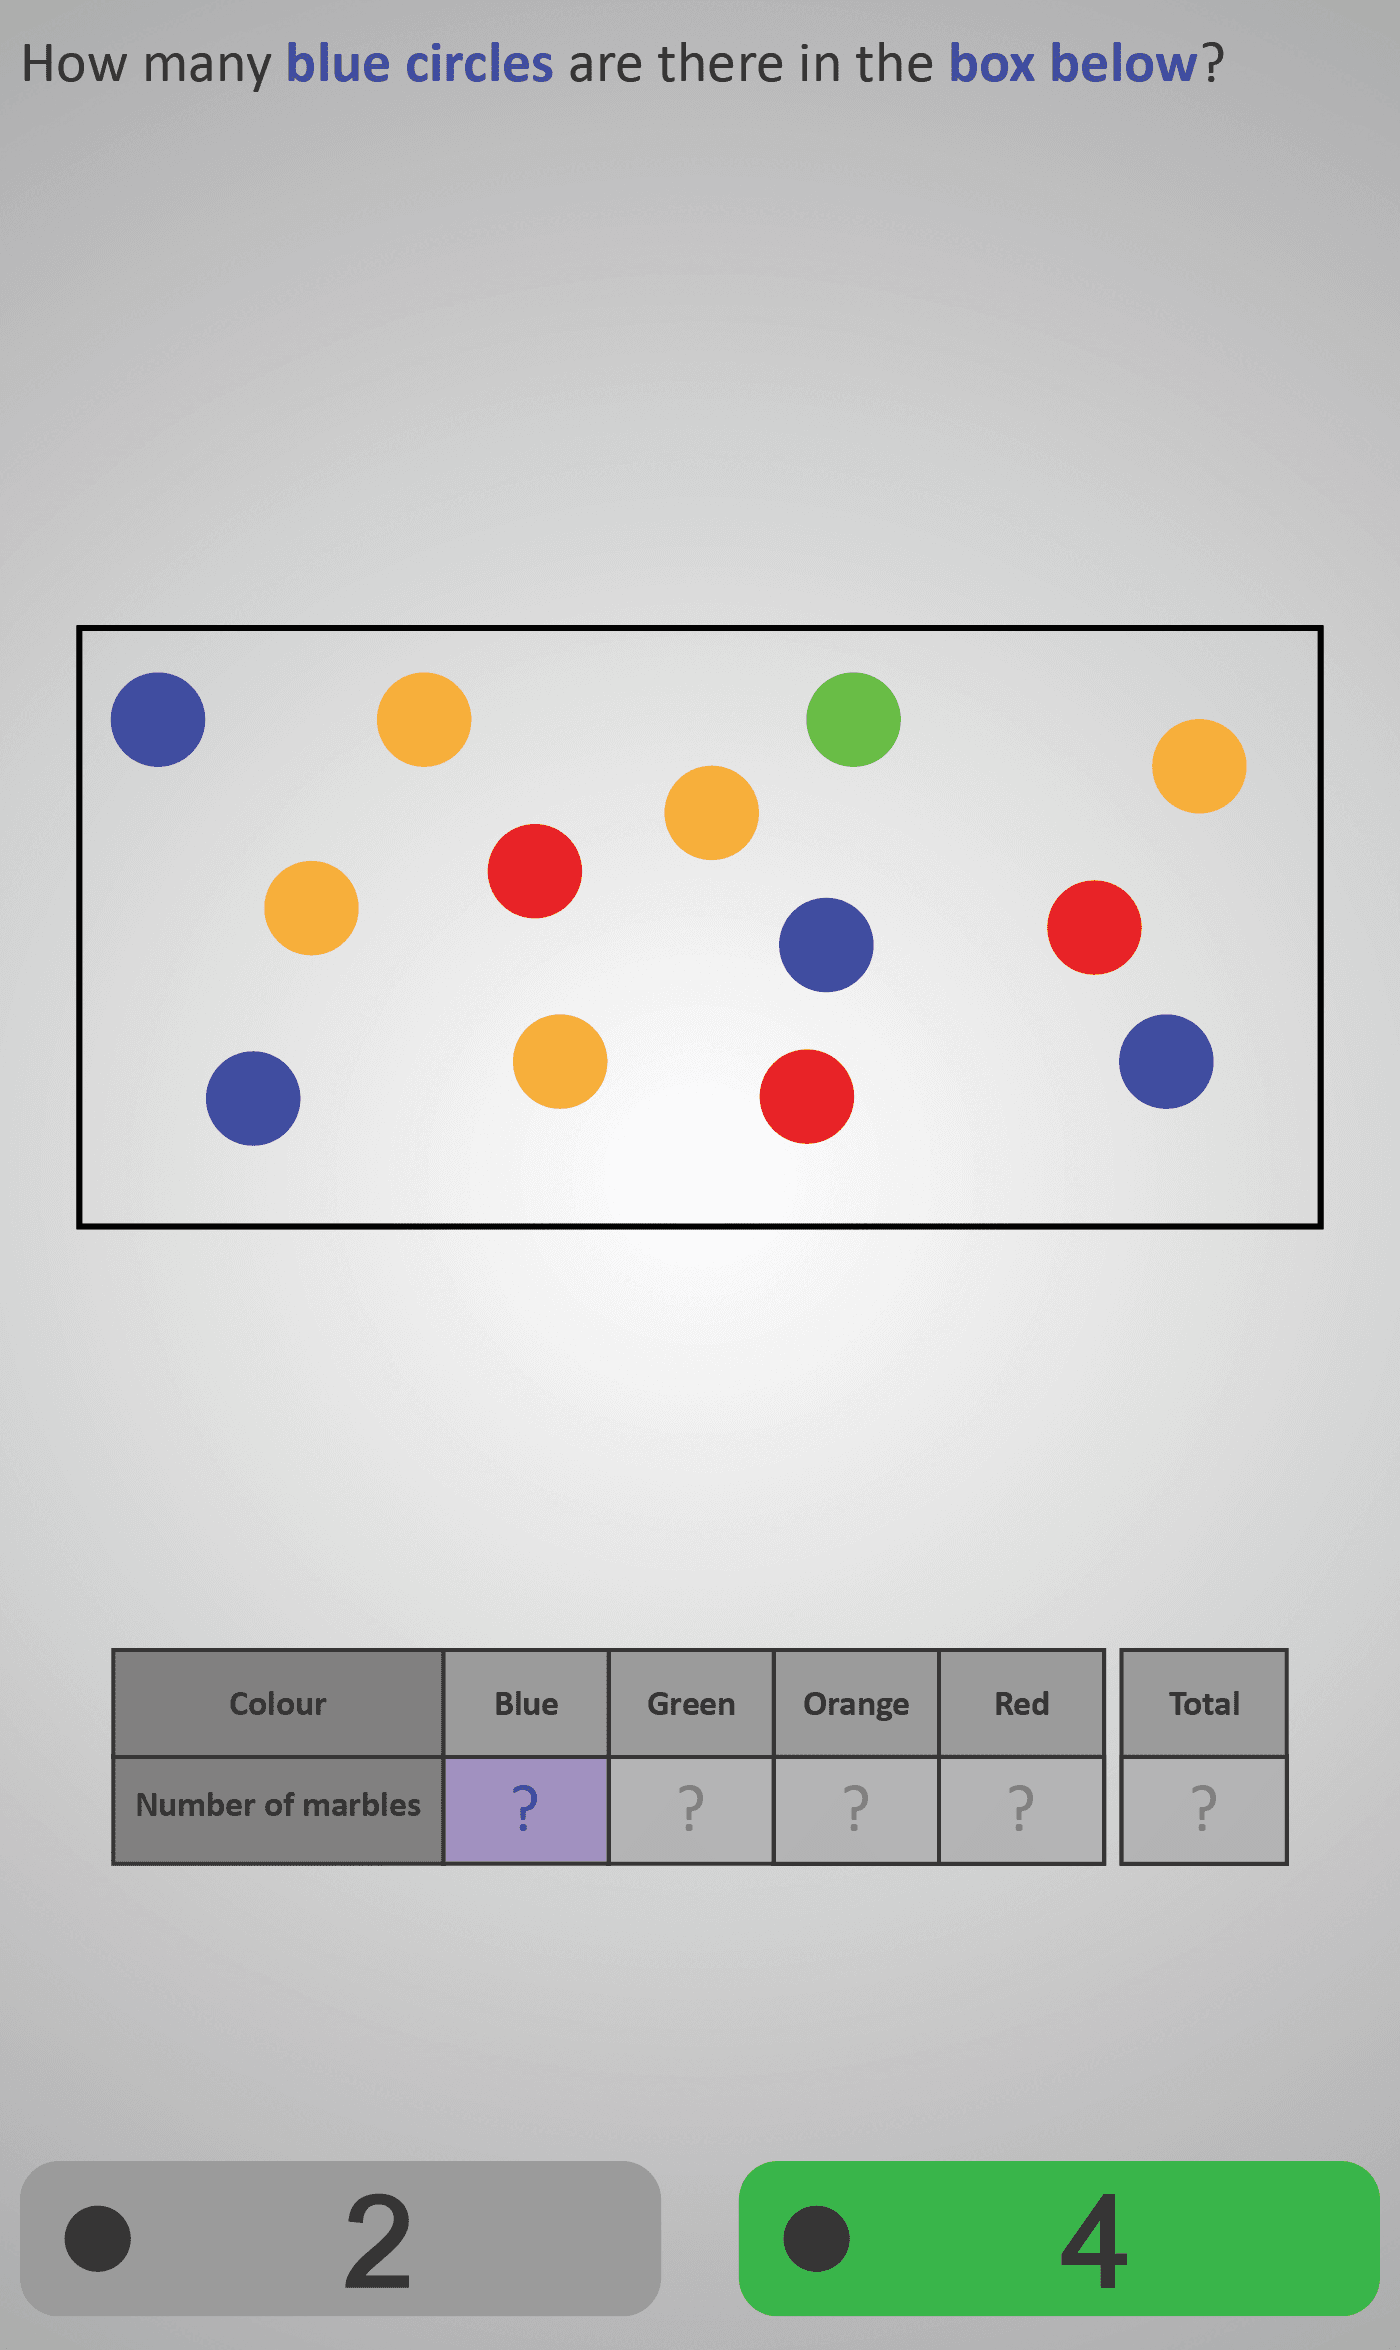
Step 1: Counting by Category
The sequence begins by asking: “How many blue circles are there?” Students count and input the correct number into the “Blue” column of the table. They then repeat this process for green, orange, and red circles, gradually completing the table row by row.
Step 2: Finding the Total
Once all categories are filled in, learners calculate the total number of circles to verify their counts and strengthen their understanding of summation and classification.
This hands-on approach helps students understand that data can be collected from real-world objects or observations and then represented clearly in a structured format. The consistent visual layout and colour-coded design support recognition, counting accuracy, and understanding of how tables are used to organise data effectively.
By the end of this Phlow, learners can confidently count, categorise, and total simple datasets — essential foundations for bar charts, pictograms, and further statistical analysis in higher levels.
Prerequisite Knowledge Required
- Linked Phlows: Add 1–2 – counting and adding small numbers.
- Visual Patterns 2 – recognising and grouping by colour or shape.
- Number Sense 2 – understanding one-to-one correspondence when counting.
Main Category
Data and Statistics – Collecting and Representing Information
Estimated Completion Time
Approx 6–8 seconds per question. 5 questions total. Total time: 40–60 seconds.
Cognitive Load / Step Size
Low — each step isolates one colour or total. Visual repetition builds familiarity, while the final summation consolidates understanding without overloading working memory.
Language & Literacy Demand
Very Low — short, direct questions (“How many blue circles?”). Key words (colour, number, total) reinforce early data vocabulary in context.
Clarity & Design
Excellent — simple, high-contrast visuals and consistent question phrasing. Each circle’s colour clearly corresponds to a labelled table column, promoting clarity and reducing cognitive strain.
Curriculum Alignment
Irish Curriculum Strand: Statistics and Probability – Data Representation and Analysis
- Collect, classify, and count data using tables.
- Represent observed data systematically.
- Understand the concept of total and category frequency.
- Build readiness for pictograms and bar charts.
Engagement & Motivation
High — learners actively count visible objects, giving a concrete sense of achievement. The colourful, game-like interface keeps attention focused while reinforcing key numeracy and organisation skills.
Error Opportunities & Misconceptions
- Miscounting due to visual grouping.
- Forgetting to include all items when summing totals.
- Confusing columns or colours.
The step-by-step structure and visual reinforcement minimise these risks through repetition and feedback.
Transferability / Real-World Anchoring
Strong — counting and recording occur in everyday contexts such as surveys, inventories, and charts. This Phlow mirrors how data is collected in experiments and daily observations.
Conceptual vs Procedural Balance
Balanced — students both perform the procedure (count and record) and understand the concept (organising data by category).
Learning Objectives Addressed
- Identify and count items by attribute (e.g., colour).
- Record data in a structured table.
- Find category totals and overall sums.
- Recognise how data tables summarise information clearly.
What Your Score Says About You
- Below 5: Beginning — needs more focus when counting or recording accurately.
- 5–7: Developing — generally accurate, but occasional miscounts or skipped categories.
- 8–9: Proficient — counts and records consistently with minor slips.
- 10 / 10: Mastery — confidently collects and organises data into clear tables with accurate totals.