Analyse 3D
Overview
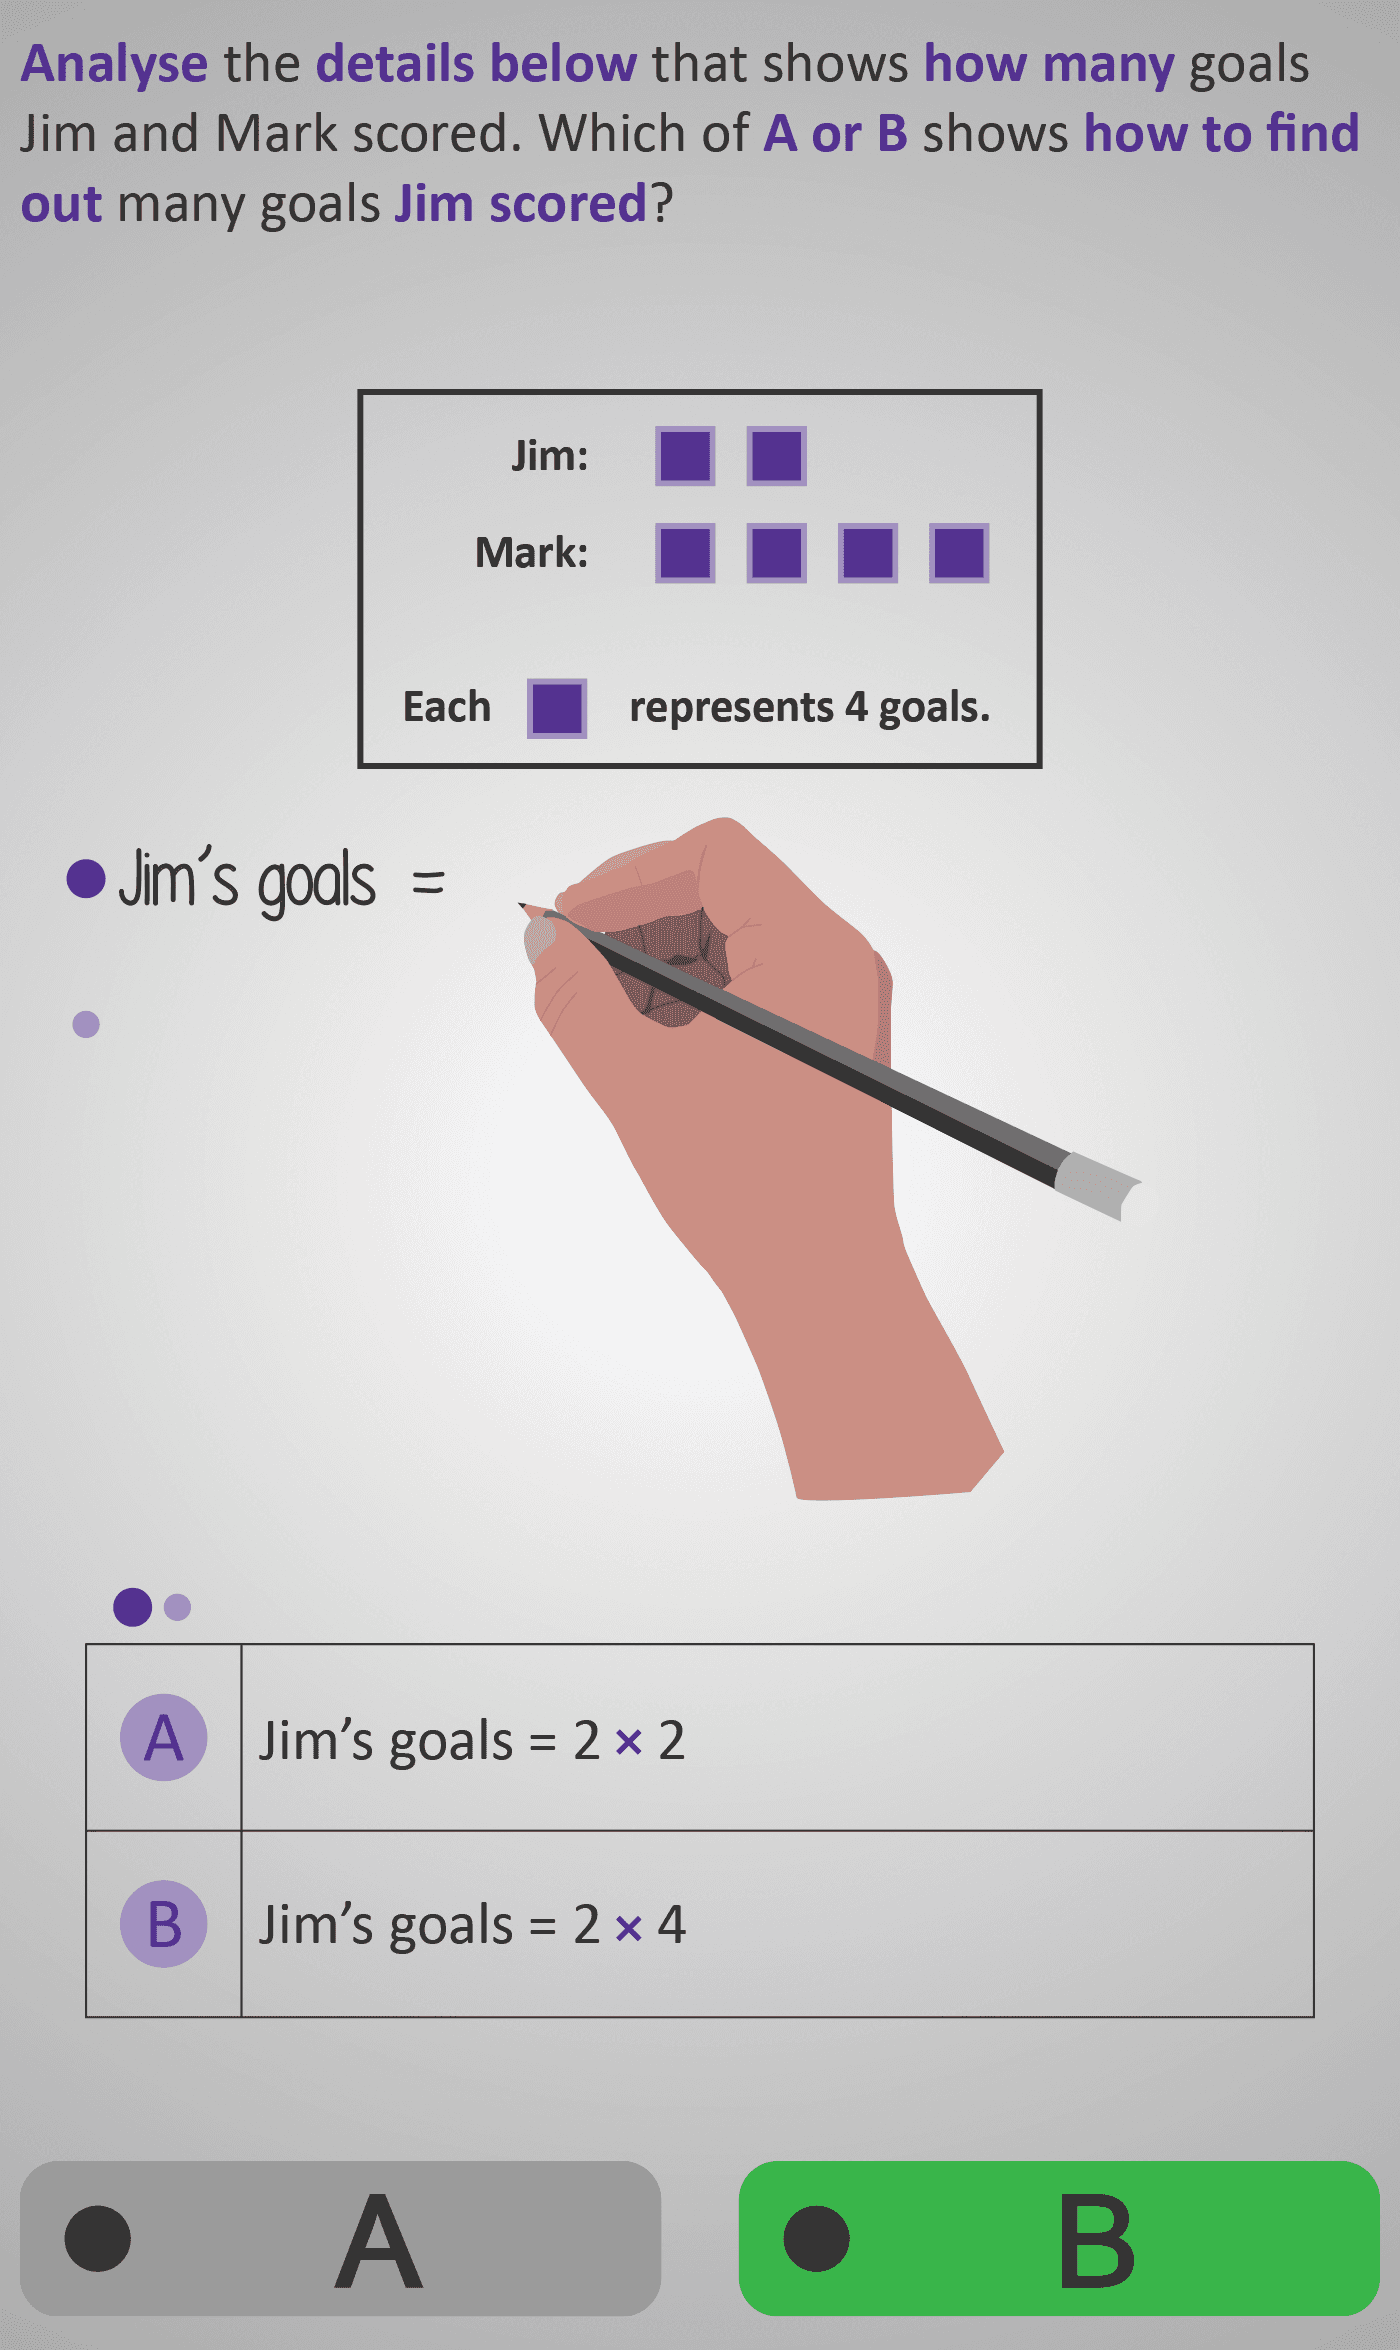
Helps learners interpret data presented in a pictogram, where each symbol stands for a certain number of items. Using a real-world sports example, students learn how to calculate how many goals Jim and Mark scored, and how many goals were scored in total.
Step 1: Interpreting Symbols
Each purple square represents 4 goals, and learners are guided step-by-step to express the total number of goals using multiplication and addition. The activity begins with identifying how many pictures represent Jim’s goals.
Step 2: Forming Number Sentences
Students then calculate totals by forming and simplifying number sentences such as:
Jim’s goals = 2 × 4
Total goals = (2 + 4) × 4
Through this process, learners connect repeated addition and multiplication, building a foundation for interpreting larger sets of data efficiently. Visuals are simple and supportive, reinforcing how multiplication represents groups of equal value.
By the end, students confidently read pictograms, form expressions from data, and solve multi-step problems that combine addition and multiplication.
Prerequisite Knowledge Required
- Linked Phlows: Multiply 2 – understanding multiplication as repeated addition.
- Add 2 – adding small numbers accurately.
- Analyse 3B – reading data from line graphs.
- Analyse 3C – reading and comparing bar charts.
Concepts Needed:
- Recognising multiplication as “groups of” a number.
- Understanding simple visual representations (each symbol = a set value).
- Adding and multiplying single-digit numbers.
Main Category
Data and Statistics – Pictograms and Visual Data
Estimated Completion Time
Approx 1.5–2 minutes total (5–6 screens). Each step: 12–15 seconds on average.
Cognitive Load / Step Size
Moderate — the visual–numeric link is clearly scaffolded. Students move gradually from identifying symbols to forming number sentences, then solving totals.
Language & Literacy Demand
Low — consistent, short phrasing (“How many goals…?”, “Which shows how to find out…?”). Mathematical symbols (×, +, =) are introduced in context, reducing cognitive strain.
Clarity & Design
Excellent — clear layout with labelled pictogram and minimal distractions. The purple blocks act as visual anchors for “groups of 4,” helping learners connect visuals and operations seamlessly. The handwritten animation reinforces step-by-step reasoning.
Curriculum Alignment
Irish Curriculum Strand: Statistics and Probability – Representing and Interpreting Data
- Read and interpret data from pictograms.
- Use multiplication and addition to find totals.
- Recognise how pictures can represent groups of equal quantities.
- Construct and solve expressions using real-world data.
Engagement & Motivation
High — the sports theme is familiar and motivating. The use of animation and symbolic repetition keeps learners active and curious as they “discover” how multiplication simplifies repeated addition.
Error Opportunities & Misconceptions
- Misreading how many each picture represents.
- Adding pictures instead of multiplying by the value per picture.
- Forgetting to include both groups (Jim + Mark) when finding totals.
These are addressed through clear prompts, repetition, and immediate feedback.
Transferability / Real-World Anchoring
Strong — pictograms are common in school charts, sports summaries, and surveys. This builds readiness for later analysis of bar charts, line graphs, and frequency tables.
Conceptual vs Procedural Balance
Balanced — learners first grasp conceptually what each picture means, then practise forming and solving the matching equations procedurally.
Learning Objectives Addressed
- Identify what each symbol represents in a pictogram.
- Use multiplication to find totals efficiently.
- Combine groups to find overall totals.
- Translate visual data into mathematical expressions.
What Your Score Says About You
- Below 5: Beginning — can read simple pictograms but needs help forming number sentences.
- 5–7: Developing — understands the structure but may mix up addition and multiplication.
- 8–9: Proficient — interprets and calculates data confidently.
- 10 / 10: Mastery — fully understands how pictograms link to multiplication and total data representation.