Analyse 3E
Overview
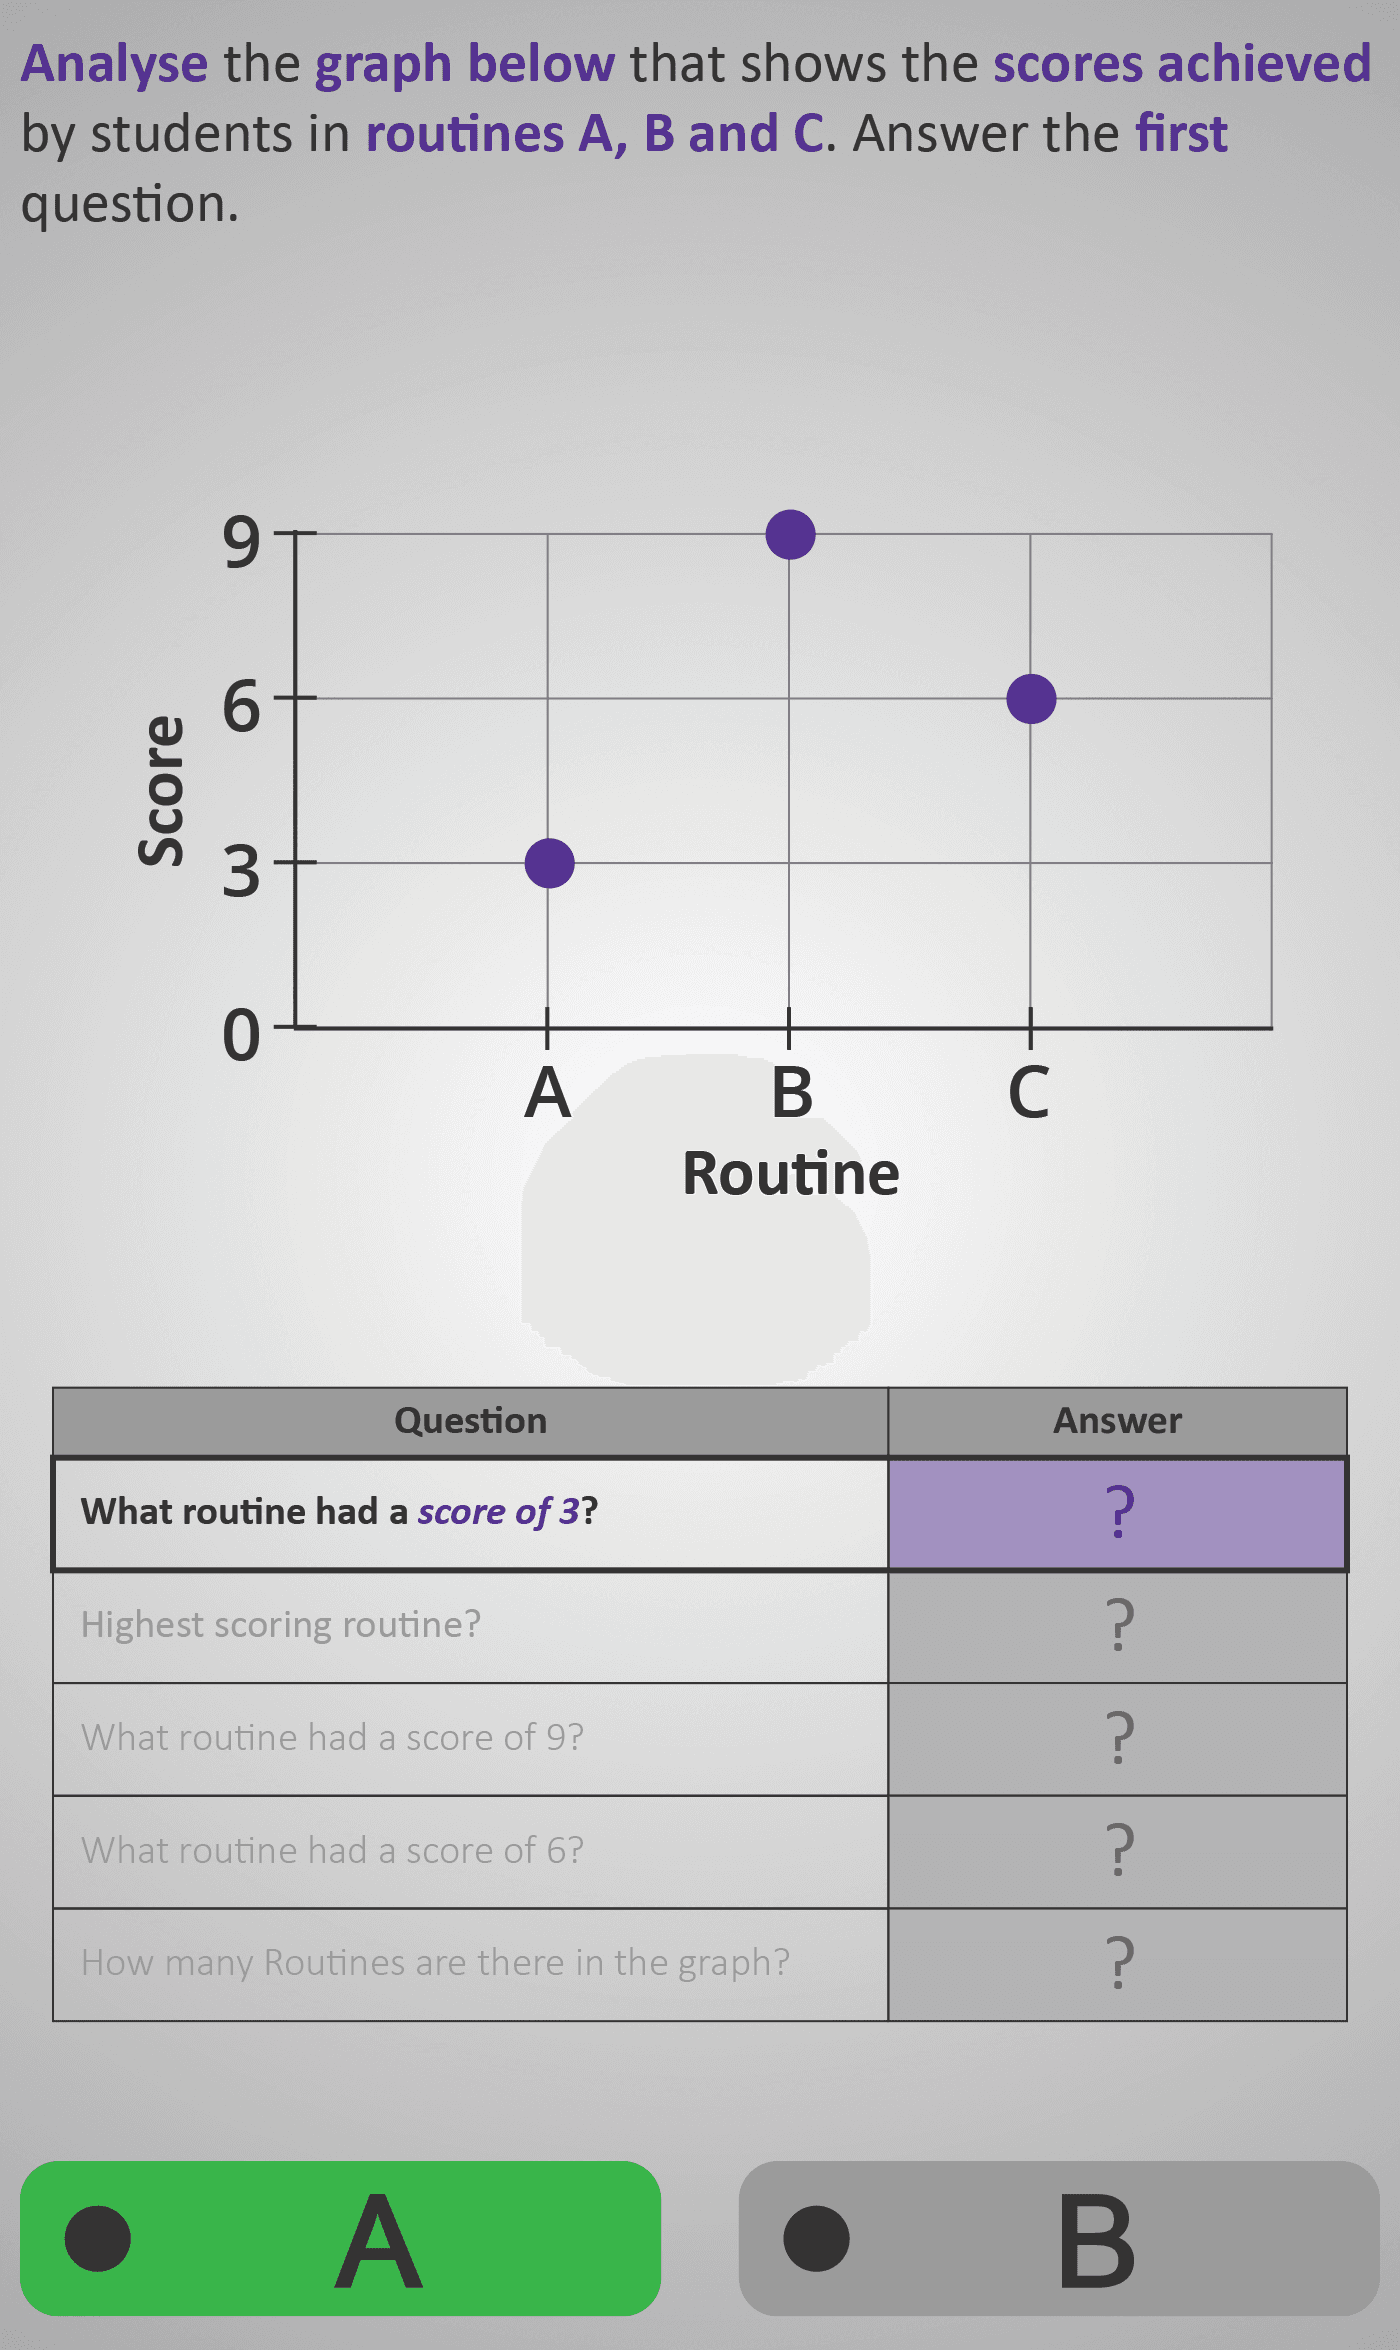
Learners explore how a line graph represents information using points plotted along two axes. The x-axis shows categories (routines A, B and C), while the y-axis shows scores achieved. Students learn to match each routine with its corresponding score and answer structured questions that build progressively — from identifying individual scores to comparing and counting items.
Step 1: Identifying Individual Scores
The sequence begins by locating the score of 3 and matching it to routine A. Learners then identify which routine scored 6 (routine C), gradually building accuracy in reading data points.
Step 2: Comparing Values
Students find the highest scoring routine (routine B) and compare it to the others. They also answer which routine had the lowest score, strengthening comparative reasoning.
Step 3: Counting and Summarising
Finally, learners count how many routines appear in total, reinforcing categorisation and attention to scale. The design scaffolds understanding by pairing clear visuals with short, direct questions. Repetition of the same structure helps learners develop automaticity in connecting visual coordinates to numerical meaning.
By the end, students can read a simple line graph accurately, extract values, and explain which routine performed best or least well — laying the groundwork for more advanced graph and statistics Phlows.
Prerequisite Knowledge Required
- Linked Phlows: Analyse 3C – Bar Charts – reading height-based data comparisons.
- Add 2 – simple addition and comparison of small numbers.
- Analyse 3A/3B – understanding what data represents in visual form.
Concepts Needed:
- Recognising horizontal (x) and vertical (y) axes.
- Understanding how points represent pairs of values.
- Reading and comparing numbers up to 10 on a graph.
Main Category
Data and Statistics – Line Graphs and Trends
Estimated Completion Time
Approx 1.5–2 minutes (5 screens). Each question: 12–15 seconds on average.
Cognitive Load / Step Size
Low to Moderate — one visual concept (points on axes) repeated with small variations. The learner moves step-by-step from recognising one value to comparing several, ensuring mastery before progression.
Language & Literacy Demand
Low — phrasing is simple and repetitive (“What routine had a score of 3?”, “Highest scoring routine?”). Colour and emphasis guide learners to key terms (score, routine, highest).
Clarity & Design
High — clean grid, bold points, and a concise table reinforce dual coding between visual and textual information. The transition from question-by-question builds automaticity in data reading.
Curriculum Alignment
Irish Curriculum Strand: Statistics and Probability – Representing and Interpreting Data
- Read and interpret simple line graphs.
- Identify highest, lowest, and specific data points.
- Count categories shown in a graphical display.
- Compare values using data from a chart or graph.
Engagement & Motivation
Moderate to High — the physical context of routines and scores provides relevance and a sense of competition. Quick feedback after each response reinforces attention and learning flow.
Error Opportunities & Misconceptions
- Confusing x-axis (routine) and y-axis (score).
- Misreading where the dot aligns with the grid line.
- Forgetting that equal spacing on the axis represents equal increments.
Errors are reduced by consistent scaling and reinforced wording (“score of 6”, “routine B”).
Transferability / Real-World Anchoring
Strong — line graphs appear in sports, science, and performance data. Learners begin to see how plotted points can represent progress, comparisons, or trends over time.
Conceptual vs Procedural Balance
Conceptual understanding (what each axis and point means) precedes procedural skill (reading and comparing points). This ensures meaning before memorisation.
Learning Objectives Addressed
- Identify coordinates representing data points.
- Match categories to numerical values.
- Determine highest and lowest values on a graph.
- Recognise the total number of items represented.
What Your Score Says About You
- Below 5: Beginning — can locate some points but struggles to match values correctly.
- 5–7: Developing — reads points accurately but may confuse highest/lowest or counts.
- 8–9: Proficient — interprets and compares graph data confidently.
- 10 / 10: Mastery — reads, compares, and explains all data points quickly and accurately.