Area 3B
Overview
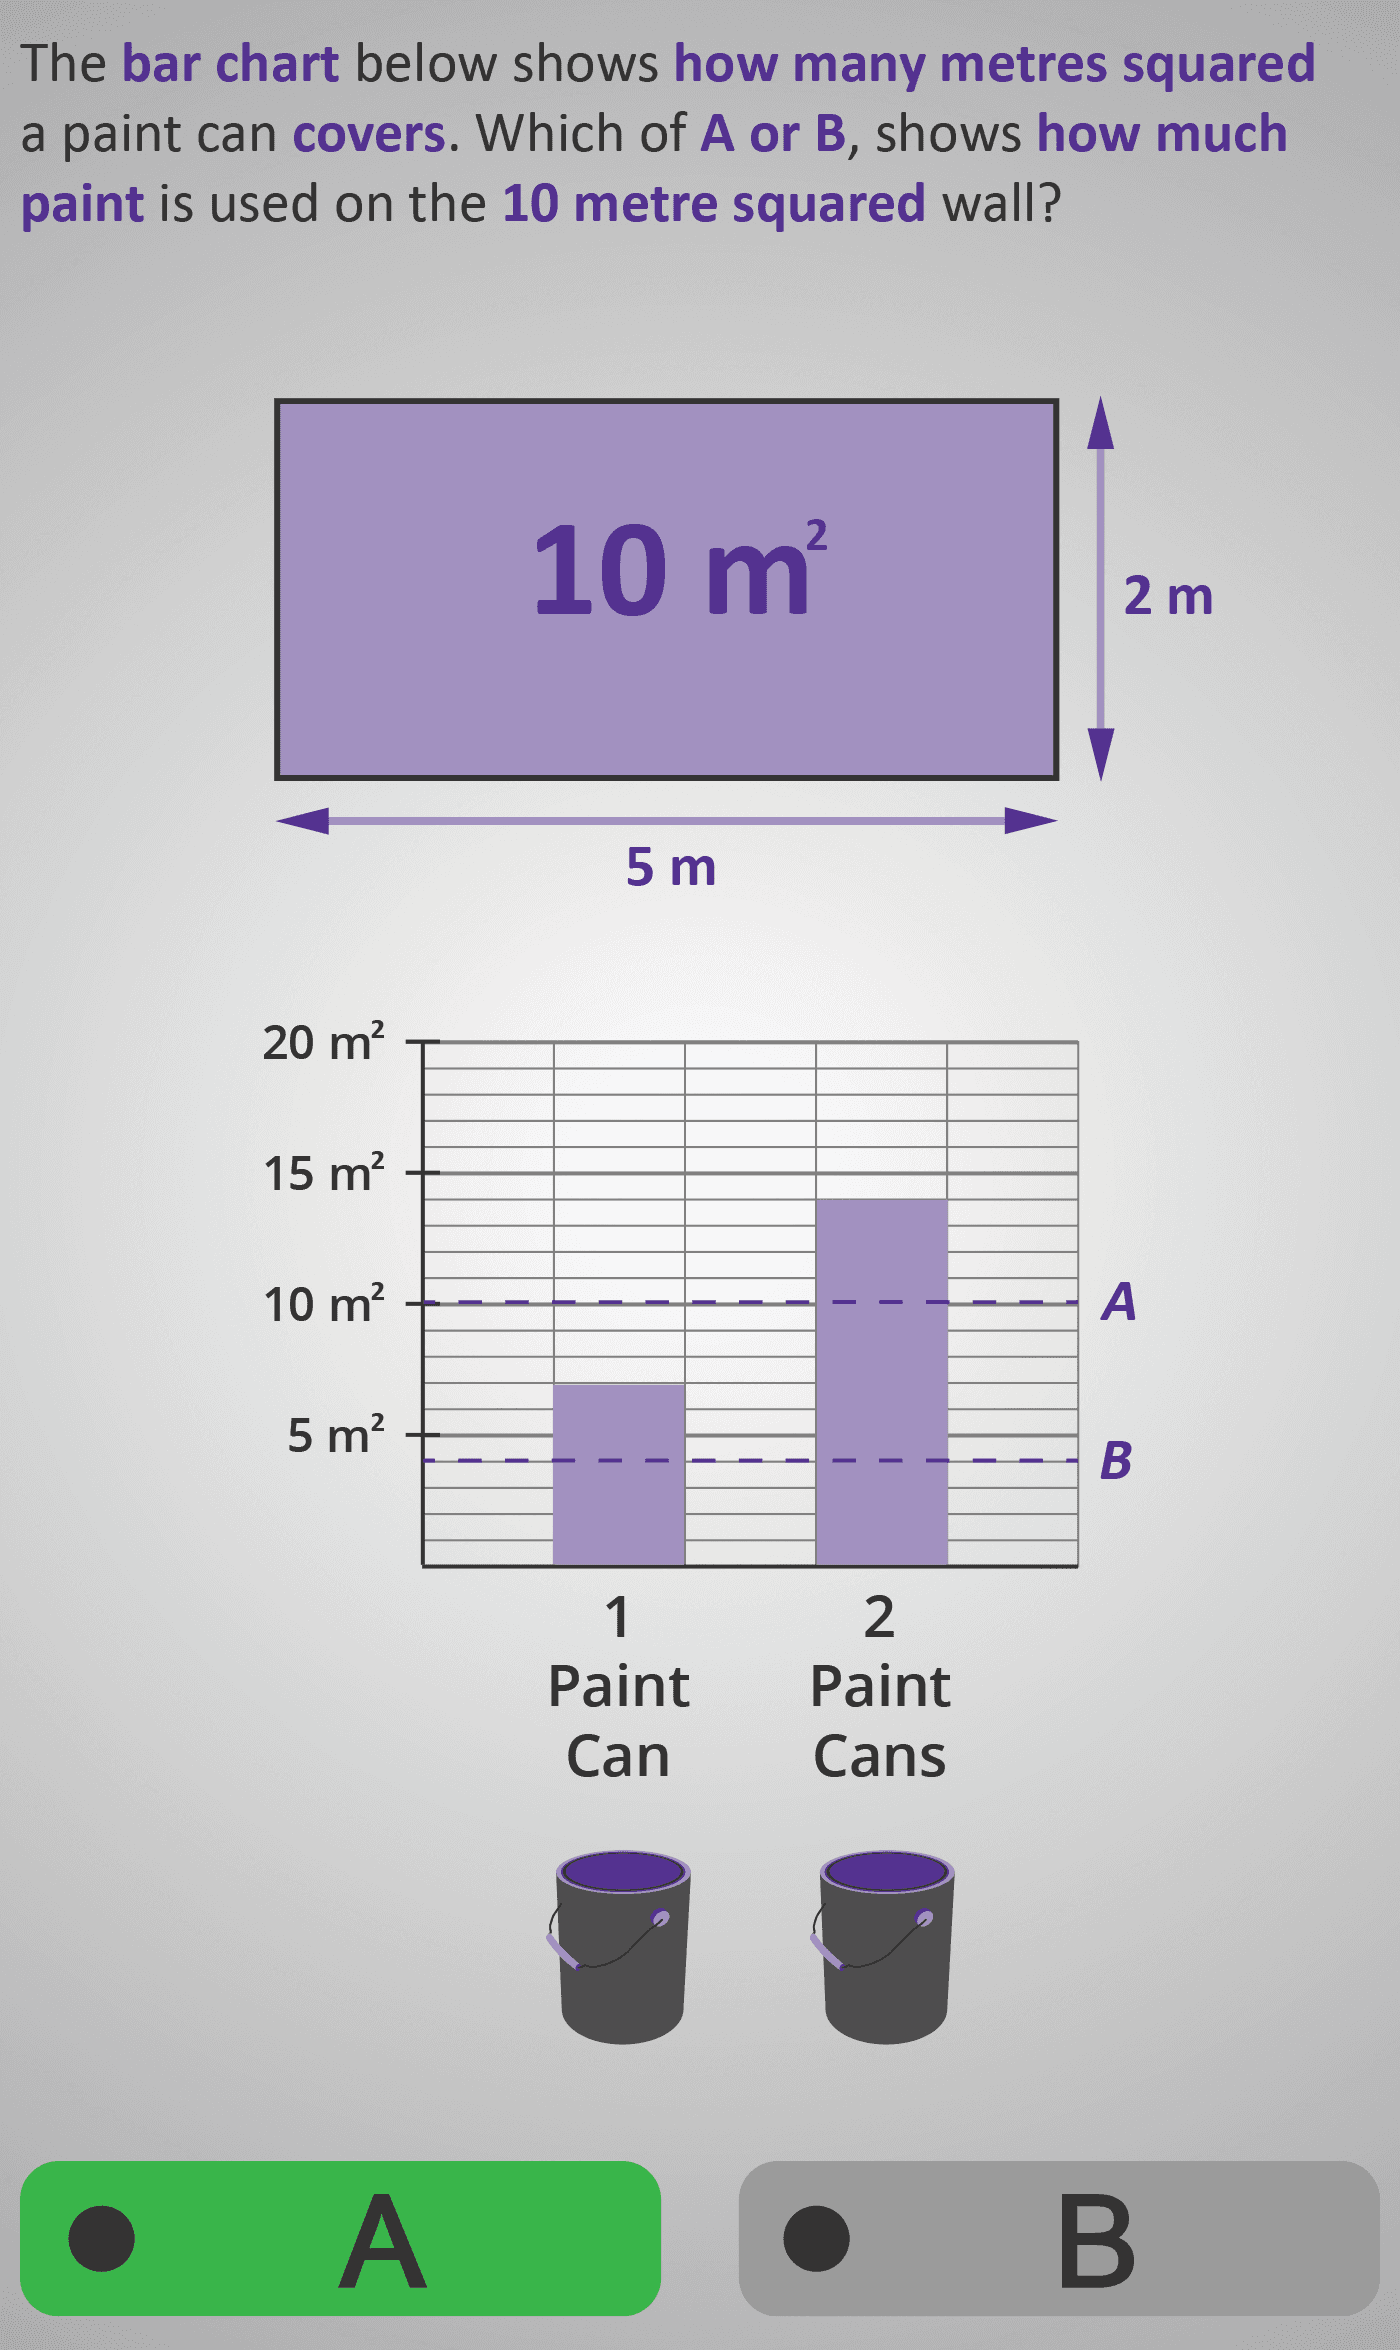
This Phlow extends students’ understanding of area into a real-life scenario: calculating how much paint is needed to cover a wall. The task introduces a bar chart where each bar represents the coverage (in m² or cm²) provided by one or more cans of paint.
Students are shown rectangular walls labelled with their total area (e.g., 10 m², 12 m², 24 cm²) and asked to match these with the correct number of paint cans based on the chart. They compare bar heights, reason proportionally, and select the correct answer through visual observation and logical deduction.
Through this process, learners connect area measurement with data interpretation and proportional reasoning. The step-by-step visuals make abstract concepts concrete and contextual — showing how maths applies directly to everyday decisions.
Prerequisite Knowledge Required
- Area 3A – Calculating the area of rectangles (Length × Height).
- Data 2B – Reading simple bar charts and comparing values.
- Number 2C – Understanding multiplication and scaling relationships.
- Measure 2A – Interpreting units (cm², m²) and conceptual conversions.
Main Category
Measurement × Data – Applied Area & Graph Interpretation
Estimated Completion Time
Approx. 10 seconds per question (30 questions total). Total Time: 5–6 minutes.
Cognitive Load / Step Size
Moderate — each screen combines two previously learned skills: reading a chart and reasoning about area. However, the visual scaffolding (identify → compare → decide) keeps the sequence clear, structured, and flow-friendly.
Language & Literacy Demand
Moderate — learners engage with short, descriptive questions (“Which of A or B shows how much paint is used on the 10 m² wall?”). Vocabulary such as area, metre squared, bar chart, and covers is reinforced through visual context.
Clarity & Design
Excellent clarity — each scene features:
- A clearly labelled rectangle representing the wall’s total area.
- A bar chart with numerical markings (m²/cm²) showing paint coverage.
- Matching paint cans beneath bars for intuitive comparison.
Purple highlights guide focus between the wall and chart. Progression from smaller to larger walls reinforces proportional reasoning.
Curriculum Alignment
Irish Junior Cycle Mathematics:
- Strand 2 – Measures (Learning Outcome 2.6): “Calculate and interpret area in context.”
- Strand 4 – Statistics and Probability (Learning Outcome 4.2): “Interpret graphical representations including bar charts.”
- Also supports Numeracy in Context outcomes through real-world reasoning.
Engagement & Motivation
The paint-and-wall context links mathematics to everyday life, giving students a tangible purpose for their reasoning. Comparing chart data visually encourages active thinking and a sense of practical achievement.
Error Opportunities & Misconceptions
- Misreading the bar chart scale (e.g., mistaking 5 m² for 10 m²).
- Forgetting that area increases proportionally with each paint can.
- Confusing the number of cans with the coverage per can.
These are addressed through repetition, scaffolded variation, and dashed guide lines marking wall area levels.
Transferability / Real-World Anchoring
Very high — this Phlow directly connects mathematical measurement to everyday planning tasks like painting, tiling, or flooring. It develops confidence in applying maths to real-world decision-making.
Conceptual vs Procedural Balance
Strongly conceptual — instead of calculating, students interpret area through proportional and graphical reasoning, strengthening estimation and applied numeracy.
Learning Objectives Addressed
- Interpret and compare data from bar charts representing area coverage.
- Connect multiplication and area to real-world applications.
- Reason proportionally between area size and paint quantity.
- Reinforce understanding of square-unit measurement.
What Your Score Says About You
- Less than 5: You may be reading chart values incorrectly — review how bar height represents area coverage.
- 6–7: You’re beginning to reason proportionally — double-check your understanding of units (m²/cm²).
- 8–9: You can read and apply bar chart data accurately in practical contexts.
- 10 / 10: Excellent — you fully understand how area and proportional reasoning apply to real-world problems like paint coverage.