Functions 3B
Overview
In this Phlow, learners apply their understanding of algebraic functions to graphical representation. They explore how to translate equations like y = 2x and y = x + 4 into points on a coordinate grid.
Each screen isolates one relationship between x and y:
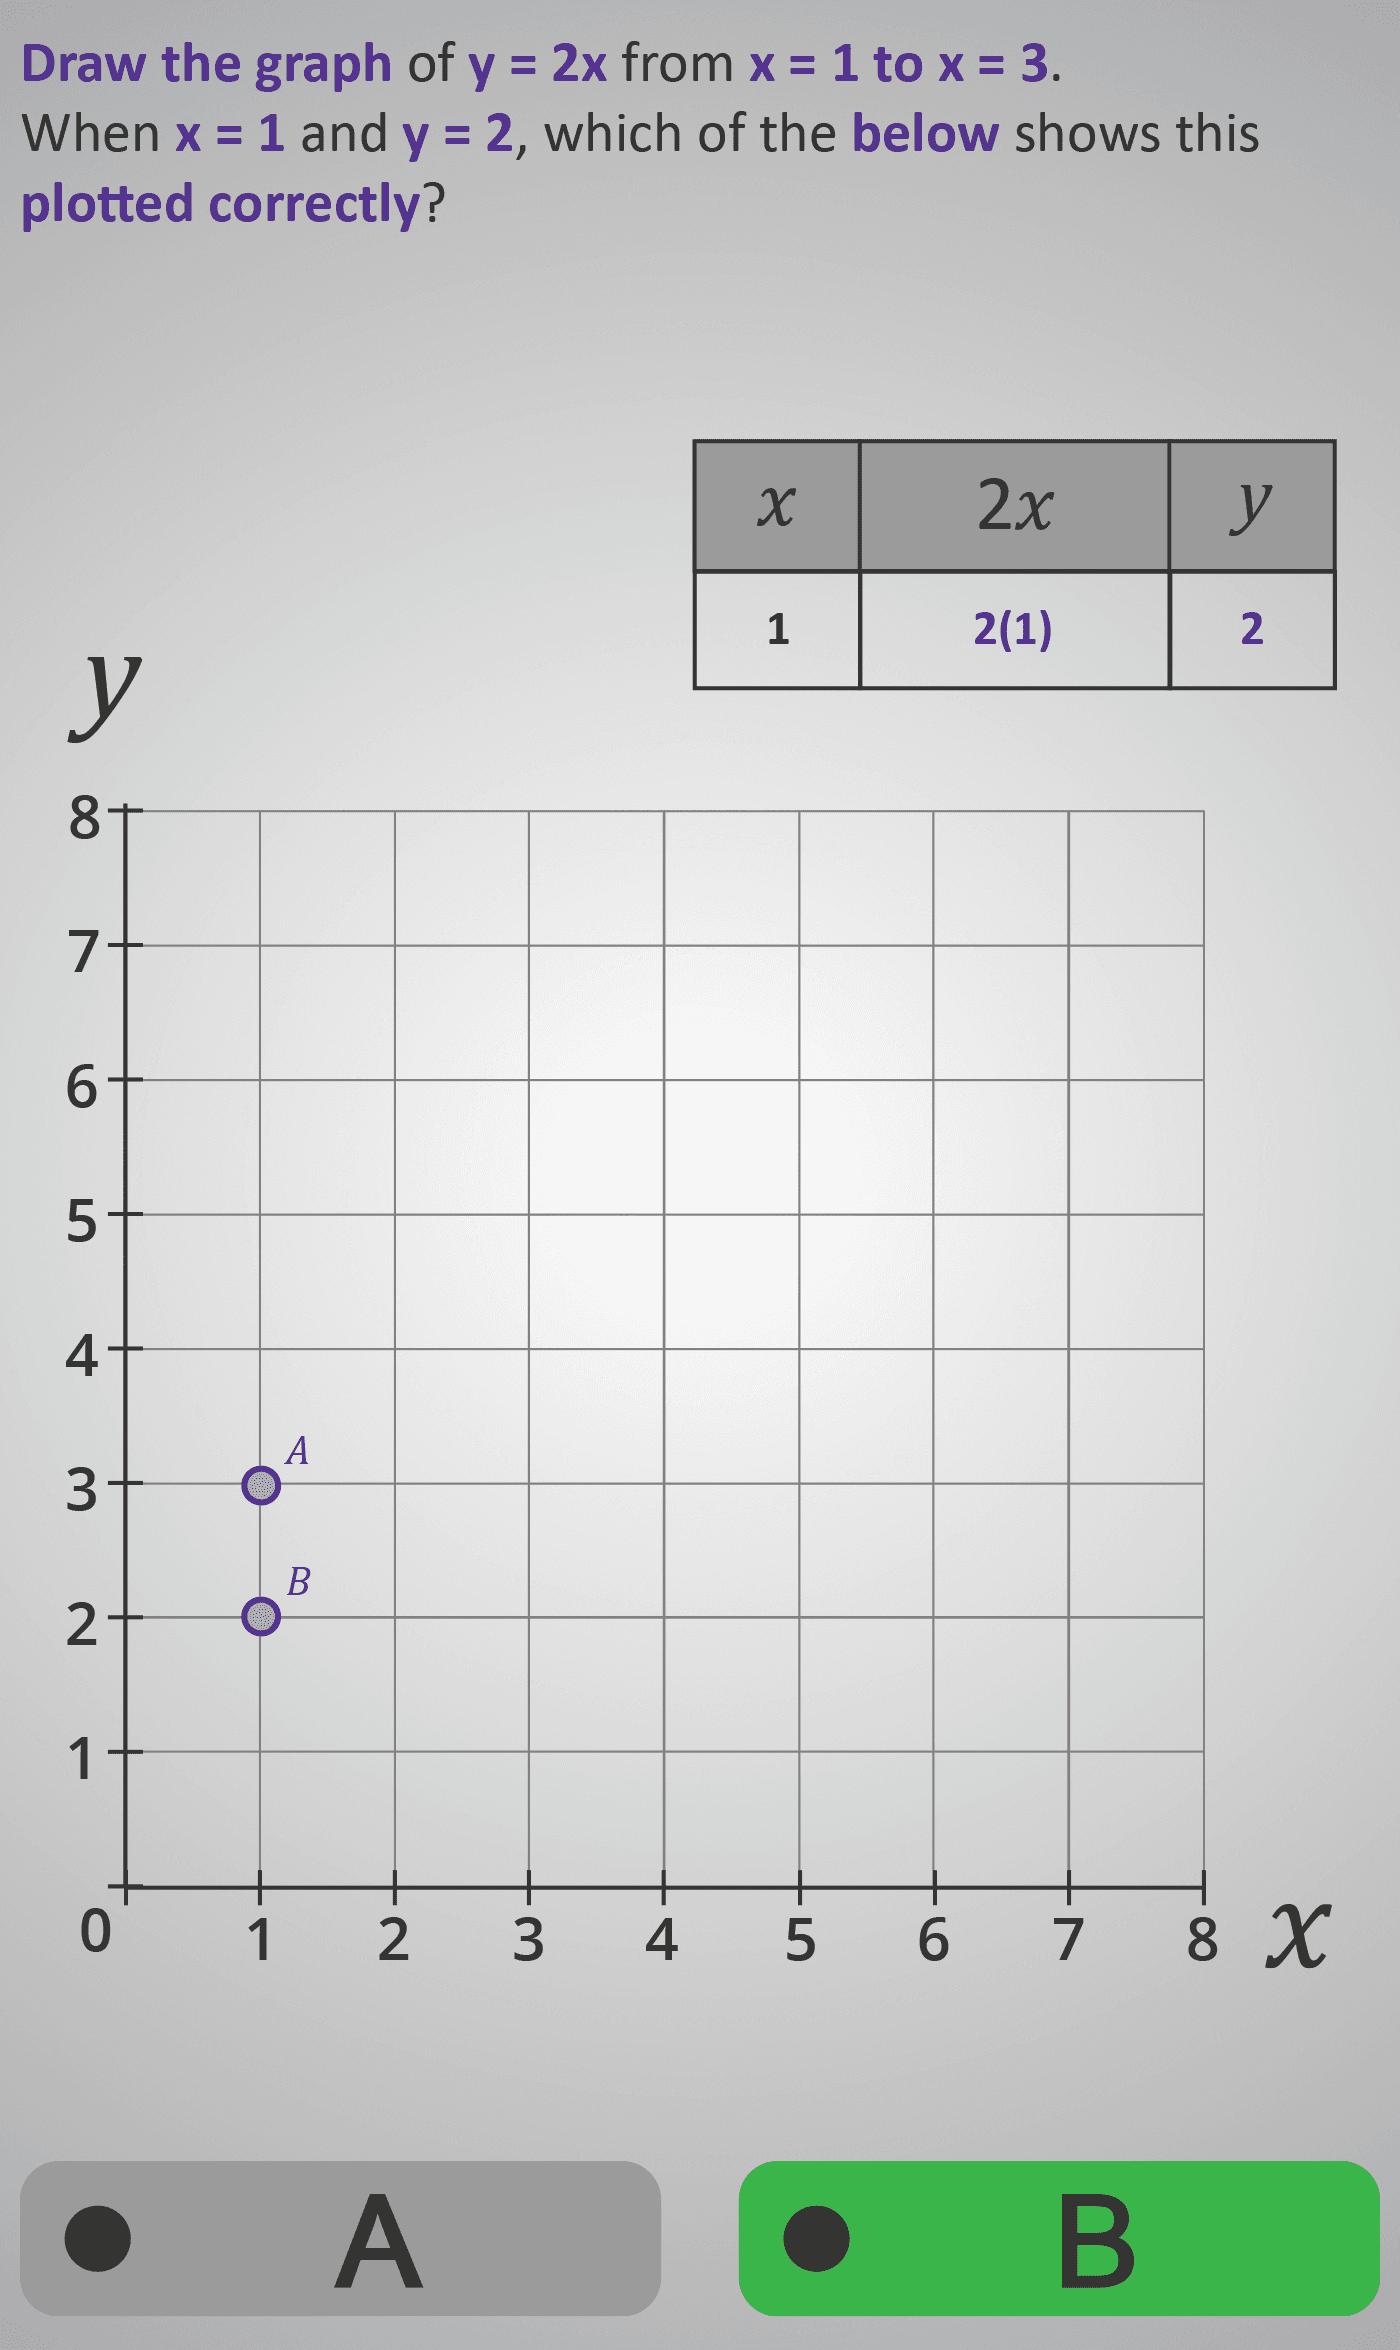
- Students are shown a function rule (e.g. y = 2x) and a given x-value.
- They substitute the value into the function (e.g. y = 2(1)), calculate the output (y = 2), and locate the coordinate (1, 2) on the graph.
- Multiple-choice visuals (A vs B) show possible plots, prompting learners to choose the correctly positioned point.
As the sequence continues, learners observe how these points align to form a straight line — the visual representation of a linear function. The process then repeats for y = x + 4, showing how the “+ 4” term shifts the line upward while maintaining the same pattern of increase.
Purple highlights mark the substituted values and plotted points, while the step-by-step reasoning connects algebraic substitution with spatial interpretation. By the end, learners understand both the numerical process and the visual meaning of graphing a linear equation.
Prerequisite Knowledge Required
- Functions 3A – Substituting into a Function Rule.
- Algebra 2B – Evaluating Simple Expressions.
- Coordinate 2A – Plotting Points on a Grid.
- Understanding that x is the input and y is the output of a function.
- Ability to substitute values into expressions (e.g. y = 2x).
- Familiarity with reading and labelling coordinate axes.
- Basic multiplication and addition fluency.
Main Category
Algebra / Graphs and Functions
Estimated Completion Time
Approx. 10–12 seconds per step (6–7 screens total). Total Time: 2–3 minutes.
Cognitive Load / Step Size
Moderate — students integrate numerical reasoning (substitution and calculation) with spatial reasoning (plotting points). Each screen presents only one substitution and plotting decision, reducing overload and supporting consistent flow.
Language & Literacy Demand
Low to Moderate — repetitive phrasing (“When x = … what is y?” and “Which is plotted correctly?”) builds fluency with algebraic and graphical terminology. Key terms like coordinate, equal to, and value of y are visually reinforced for clarity.
Clarity & Design
- Tables above each graph link numeric and visual representations.
- Clean, labelled grids minimise distraction.
- Purple highlights guide attention to key variables and outputs.
- Visual A/B choices encourage reasoning through pattern recognition.
Curriculum Alignment
Irish Junior Cycle Mathematics:
- Strand 4 – Algebra
- Substrand – Functions and Graphs
- Learning Outcomes:
- Generate and plot coordinate pairs from simple linear functions.
- Recognise that y = mx + c represents a straight-line relationship.
- Describe how changes in x affect y.
Engagement & Motivation
High — learners gain immediate visual feedback and enjoy the growing satisfaction of watching a line emerge point by point. The mix of calculation, selection, and discovery keeps attention high while reinforcing accuracy.
Error Opportunities & Misconceptions
- Reversing coordinates (plotting x and y in the wrong order).
- Misreading 2x as 2 + x.
- Plotting without first calculating y correctly.
- Assuming every line passes through the origin (0, 0).
The Phlow addresses these through consistent substitution practice, guided coordinate labelling, and clear comparisons of correct vs incorrect points.
Transferability / Real-World Anchoring
High — graphing relationships underpins analysis in science, geography, economics, and technology. Students begin to see functions as models for real-world trends, such as speed-time graphs, cost patterns, and proportional growth.
Conceptual vs Procedural Balance
Balanced — learners practise the procedure (substitute → calculate → plot) while developing a conceptual sense of how linear relationships appear as straight lines on graphs.
Learning Objectives Addressed
- Substitute numerical values into function rules to create ordered pairs.
- Plot points accurately on coordinate axes.
- Identify when a plotted point represents the correct function output.
- Recognise straight-line patterns as graphical forms of linear equations.
What Your Score Says About You
- Less than 5: Review how to calculate y-values before plotting.
- 6–7: You understand substitution but should double-check your point placement.
- 8–9: Great accuracy — you’re connecting algebra with graphing effectively.
- 10 / 10: Excellent! You can now link function rules to their visual graphs and are ready for gradients and intercepts.