Mean 3
Overview
In this Phlow, learners are introduced to the concept of the mean — a key measure of average used in statistics and everyday life. They learn to calculate it by adding all numbers together and dividing by how many numbers are in the set.
The example uses the data set 4, 3, 5, 2, 6 and guides students through three clear visual steps:
-
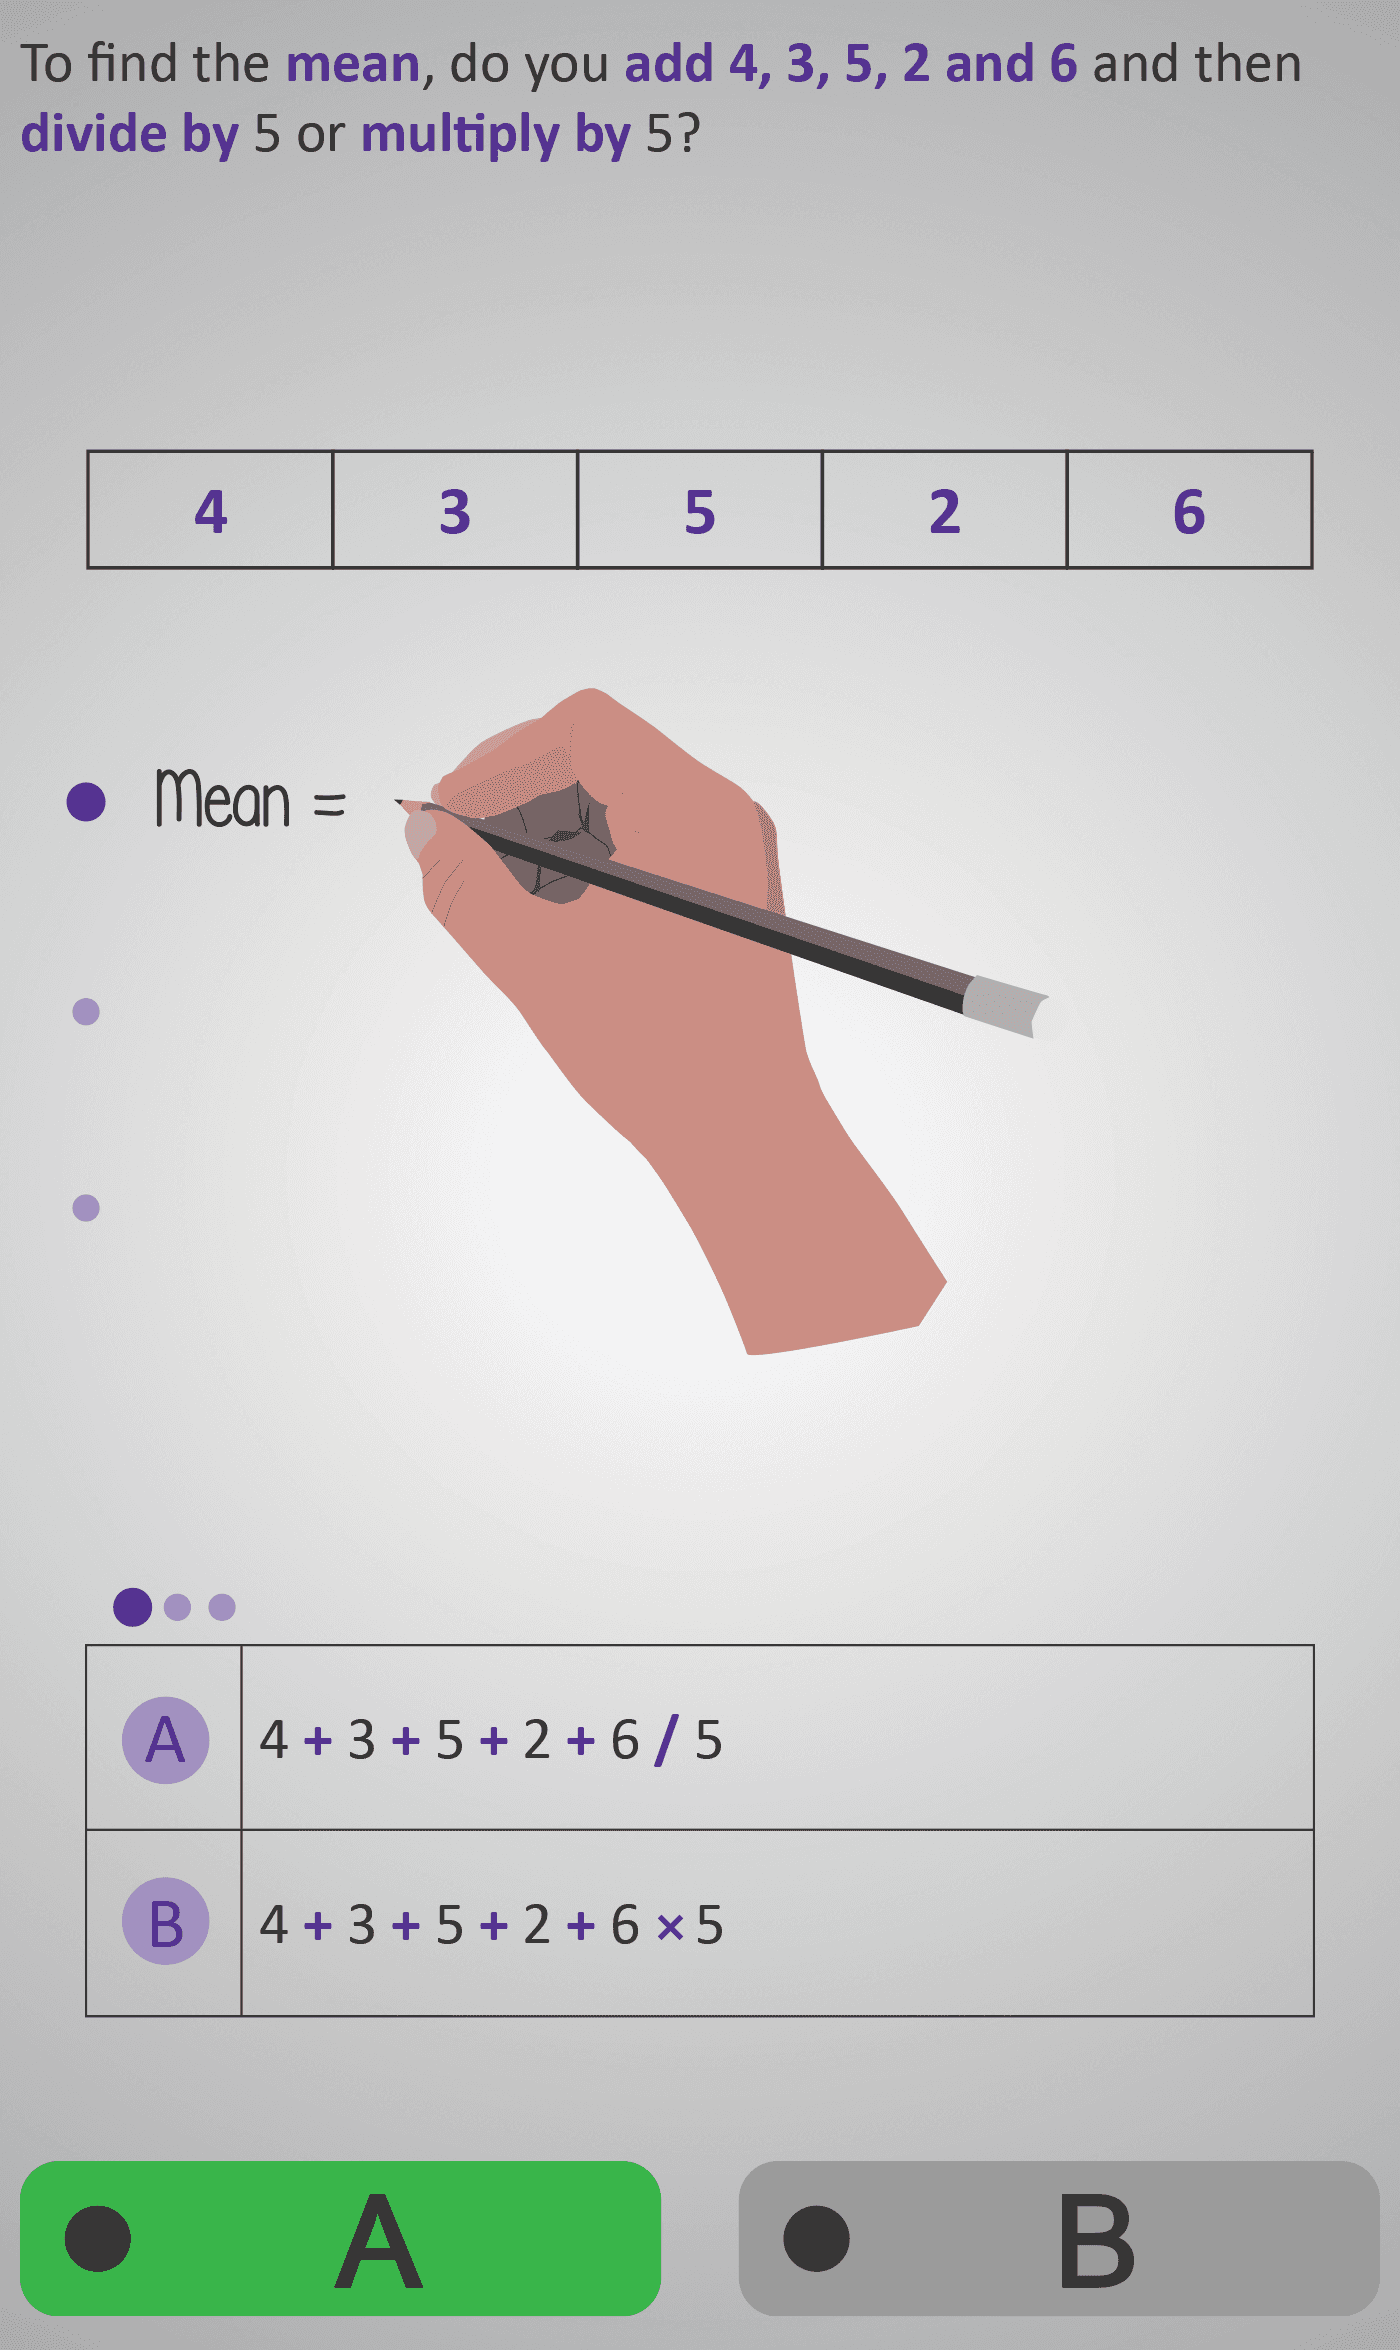
Set up the mean formula:
Students recall that to find the mean, you add all the values and divide by the number of items.
Mean = (4 + 3 + 5 + 2 + 6) ÷ 5 -
Simplify the numerator:
The total is found step by step:
4 + 3 + 5 + 2 + 6 = 20
So the expression becomes Mean = 20 ÷ 5. -
Find the final mean:
20 ÷ 5 = 4
The mean is 4, showing the “fair share” or central value of the data.
The visuals highlight each arithmetic step using consistent colour cues and clear sequencing. Students see how the mean is both a procedure (add and divide) and a concept — representing an even balance or middle point of the data set.
By the end of this Phlow, learners can confidently calculate and interpret the mean for small sets of data, preparing them for later topics such as comparing averages and analysing variability.
Prerequisite Knowledge Required
- Addition 2A – Adding Multiple Numbers.
- Division 2B – Dividing Whole Numbers.
- Fractions 2C – Simplifying Fractions.
- Understanding how to perform addition and division.
- Recognising what a data set is and counting its entries.
- Basic understanding of fractions as “part of a whole.”
Main Category
Statistics / Data Handling
Estimated Completion Time
Approx. 10–12 seconds per screen (3 screens total). Total Time: 1.5–2 minutes.
Cognitive Load / Step Size
Low — each step focuses on one stage of reasoning: setting up the operation, simplifying the numerator, and performing division. The clear sequential layout helps students follow the logic without overload.
Language & Literacy Demand
Low — key terms like mean, add, divide, and simplify are repeated and paired with visual arithmetic steps, supporting comprehension for all reading levels.
Clarity & Design
- Each line of the calculation appears directly below the last, reinforcing logical flow.
- Consistent data values maintain focus on process rather than memorisation.
- Colour highlights and handwriting animation support procedural clarity.
Curriculum Alignment
Irish Junior Cycle Mathematics:
- Strand 4 – Statistics and Probability
- Substrand – Data and Representation
- Learning Outcomes:
- Calculate the mean of a set of numbers.
- Understand the mean as “total divided by number of items.”
- Simplify expressions involving addition and division.
Engagement & Motivation
High — students enjoy the clarity and visual simplicity of each step. The immediate payoff of calculating a meaningful “average” makes the topic both engaging and rewarding.
Error Opportunities & Misconceptions
- Forgetting to divide by the number of data points.
- Dividing by the wrong number (e.g. 4 instead of 5).
- Adding incorrectly or misreading the layout of the calculation.
The Phlow prevents these through explicit, scaffolded steps — addition first, then division — with clear on-screen prompts.
Transferability / Real-World Anchoring
High — calculating averages connects to everyday contexts such as grades, test scores, weather data, and sports performance. It lays the groundwork for interpreting data patterns and comparing results across categories.
Conceptual vs Procedural Balance
Balanced — learners follow the calculation process while understanding the idea of a “fair share.” This dual focus builds confidence in both method and meaning.
Learning Objectives Addressed
- Write and interpret the mean formula.
- Add and divide to calculate the mean correctly.
- Simplify fractions and explain what the result represents.
- Connect numerical results to real-world averages.
What Your Score Says About You
- Less than 5: Review the mean formula — remember to add all numbers first, then divide by how many there are.
- 6–7: You understand the process — check your arithmetic accuracy.
- 8–9: Strong grasp of how to calculate and interpret the mean.
- 10 / 10: Excellent! You’ve mastered calculating the mean and are ready for Mean 4, where you’ll compare and interpret data sets.