Modal 3A
Overview
In this Phlow, learners are introduced to the concept of the mode (or modal number) — the value that appears most frequently in a data set. The focus is on recognising frequency patterns visually rather than performing calculations.
Through simple number grids, students learn to identify which number appears most often across three visual examples:
-
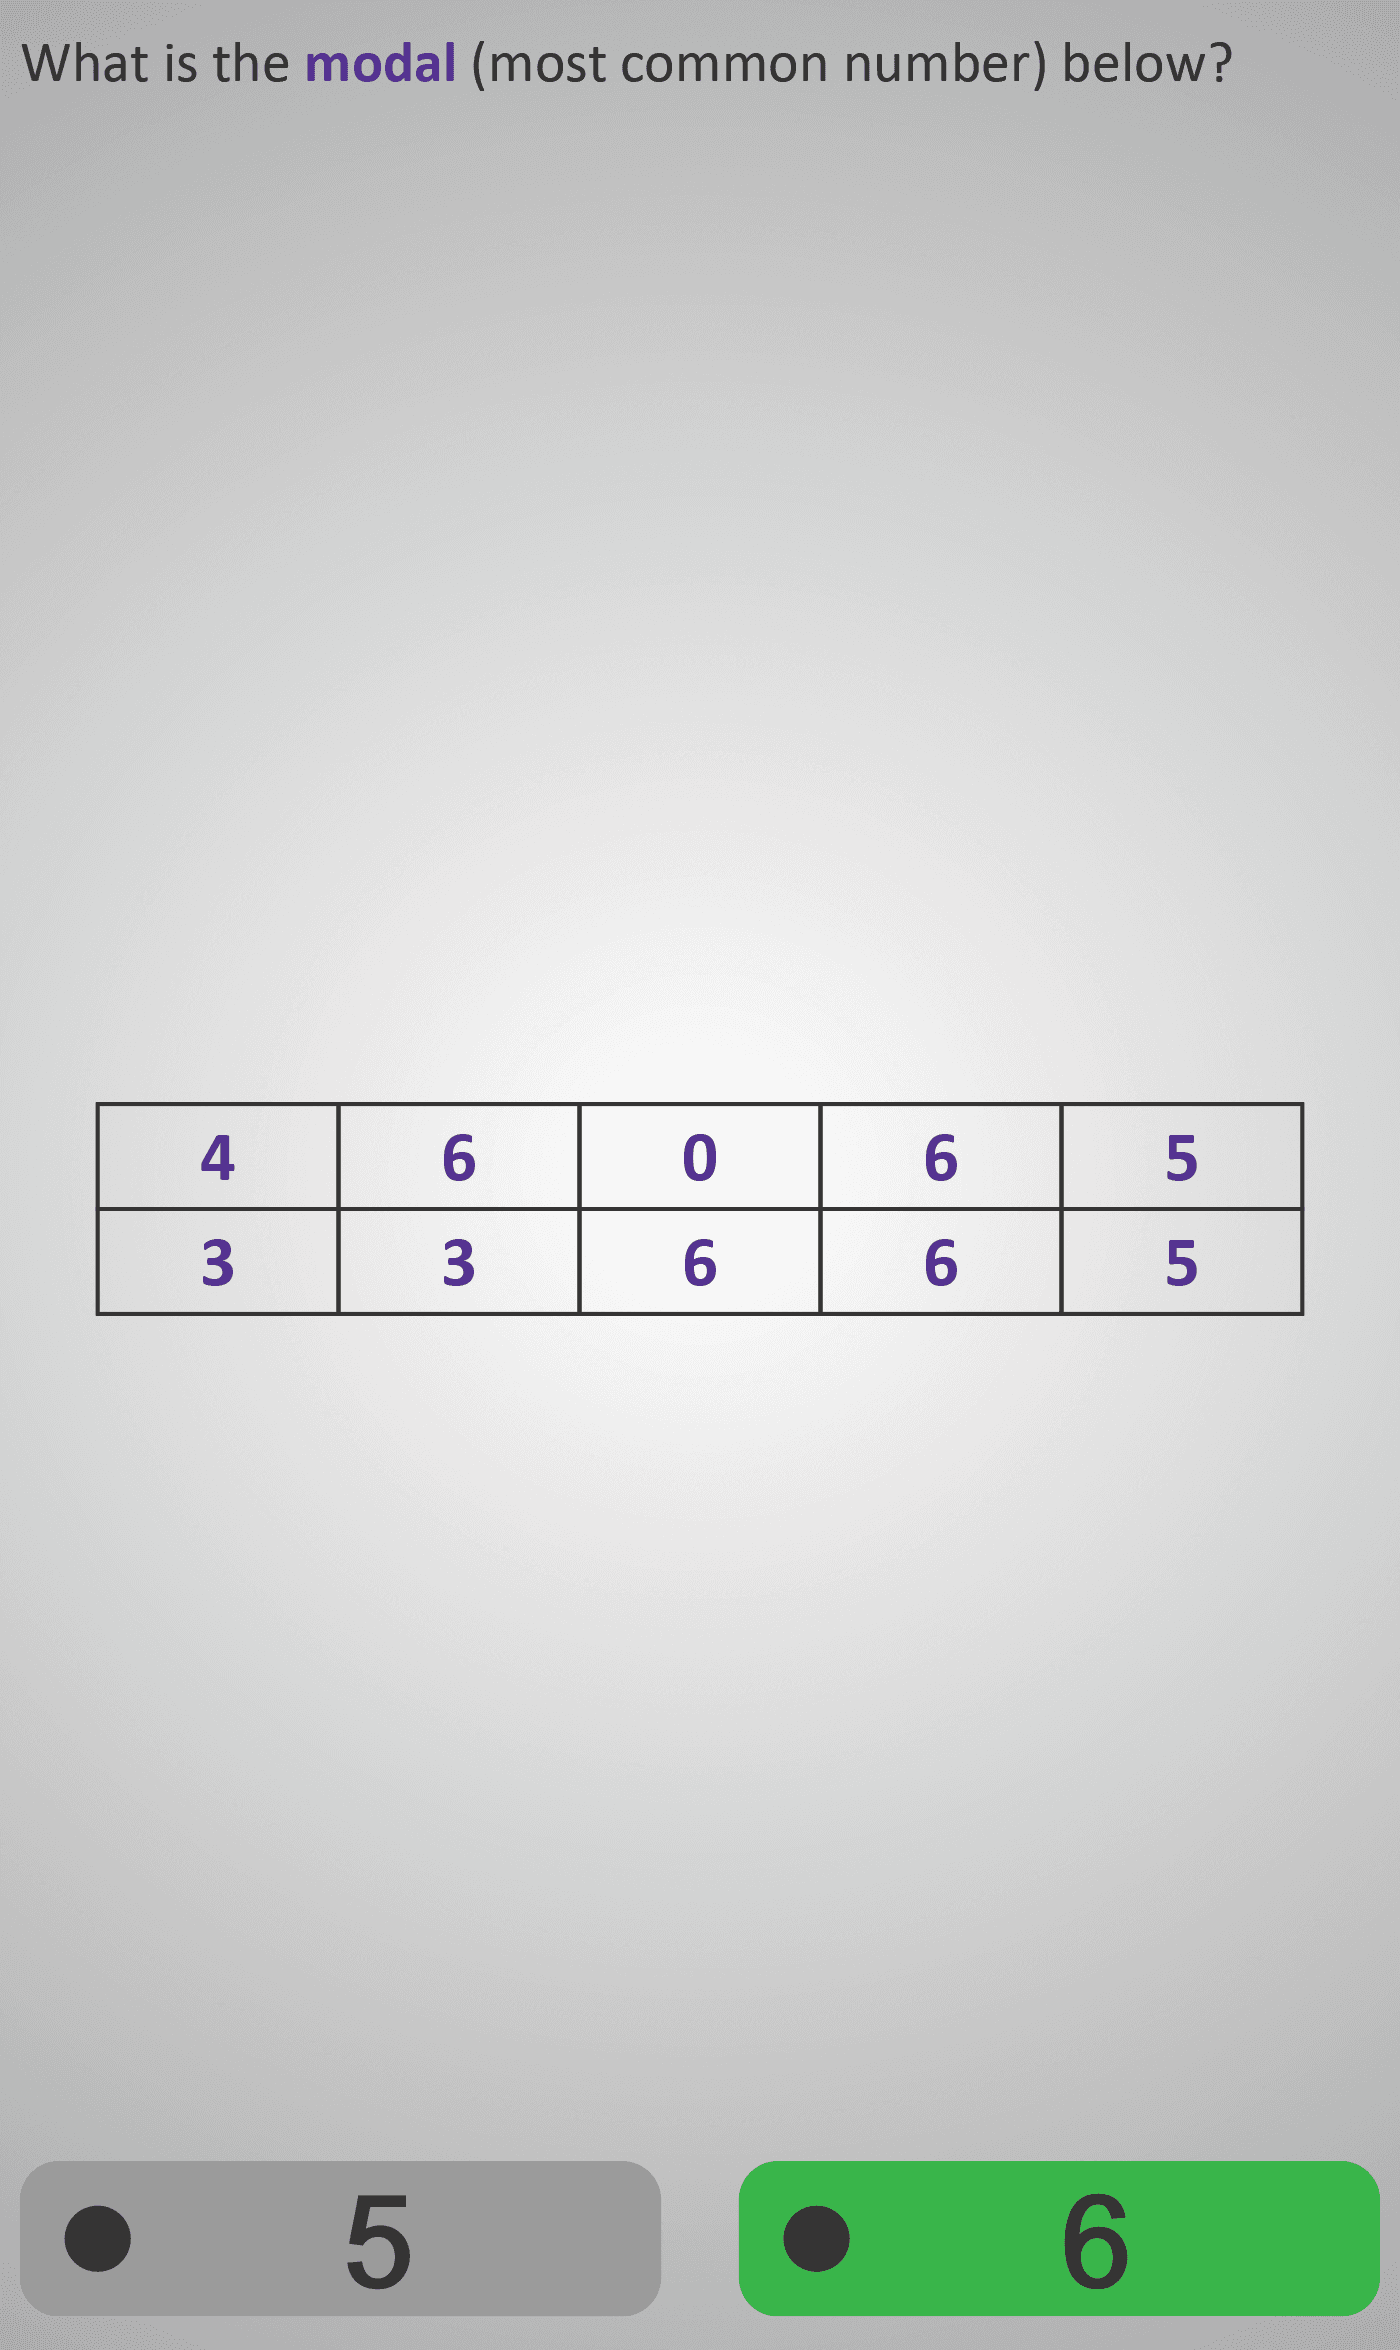
Recognising frequency:
Students observe a grid and see that 6 appears more times than any other number, understanding that the mode is about how often a number appears, not its size. -
Spotting repetition visually:
In the next example, 3 appears repeatedly throughout the grid. The repetition trains learners to “spot the mode by eye” using simple pattern recognition. -
Comparing frequencies:
A slightly larger grid challenges students to count occurrences carefully — discovering that 4 is the modal number.
The activity emphasises visual pattern detection and data interpretation, helping learners build intuitive understanding of frequency. The grid format mirrors how data often appears in tables, charts, or spreadsheets, bridging classroom learning with real-world numeracy.
By the end, students understand that the mode is the value that occurs most often, and that some data sets can have more than one mode or no mode at all if all numbers appear equally often.
Prerequisite Knowledge Required
- Counting Frequency 2A – Tally Charts.
- Mean 3 – Calculating the Mean.
- Median 3 – Finding the Median.
- Recognising and comparing numbers.
- Understanding that data sets may include repeated values.
- Counting accurately to identify frequency patterns.
Main Category
Statistics / Data Handling
Estimated Completion Time
Approx. 8–10 seconds per screen (3 screens total). Total Time: 1–1.5 minutes.
Cognitive Load / Step Size
Low — each screen focuses on one visual task: spotting the number that appears most frequently. The design encourages intuitive recognition without heavy calculation.
Language & Literacy Demand
Low — the key word modal is introduced in simple terms (“most common number”) and reinforced visually. Very little reading is required beyond identifying numbers on a grid.
Clarity & Design
- Consistent use of purple text for mathematical terminology.
- Simple, uncluttered grids make frequency patterns easy to see.
- Spacing and layout promote focus and minimise distractions.
- Repeated examples build confidence and fluency.
Curriculum Alignment
Irish Junior Cycle Mathematics:
- Strand 4 – Statistics and Probability
- Substrand – Data and Representation
- Learning Outcomes:
- Identify and interpret the mode (most common value) in a data set.
- Recognise that the mode describes data concentration and frequency.
- Differentiate between mean, median, and mode as measures of central tendency.
Engagement & Motivation
High — the grid-based format feels like a visual puzzle. Learners get immediate satisfaction from recognising patterns and finding the “most common” number. Repetition builds quick, confident decision-making.
Error Opportunities & Misconceptions
- Selecting the largest or smallest number instead of the most frequent.
- Missing tied frequencies (two or more modes).
- Confusing “mode” with “median” or “mean.”
The Phlow addresses these with guided repetition and clear reinforcement of the definition “most common number.”
Transferability / Real-World Anchoring
High — understanding mode helps interpret everyday data, such as most common test scores, popular survey responses, or typical product sizes. It prepares students for reading tables and frequency charts in real-life contexts.
Conceptual vs Procedural Balance
Conceptual — this Phlow focuses on visual understanding of frequency and repetition rather than procedural calculation, laying the groundwork for later data interpretation skills.
Learning Objectives Addressed
- Define and identify the mode (modal number).
- Recognise when data sets have one mode, multiple modes, or no mode.
- Distinguish between mean, median, and mode.
- Interpret simple data visually using grids.
What Your Score Says About You
- Less than 5: Recheck each row carefully — look for the number that appears most often.
- 6–7: Good progress — you’re recognising repeating patterns.
- 8–9: Strong understanding — you consistently identify the mode.
- 10 / 10: Excellent! You’ve mastered the concept of mode and are ready for Modal 3B, where you’ll interpret frequency tables and compare data sets.