Pie Chart 3D
Overview
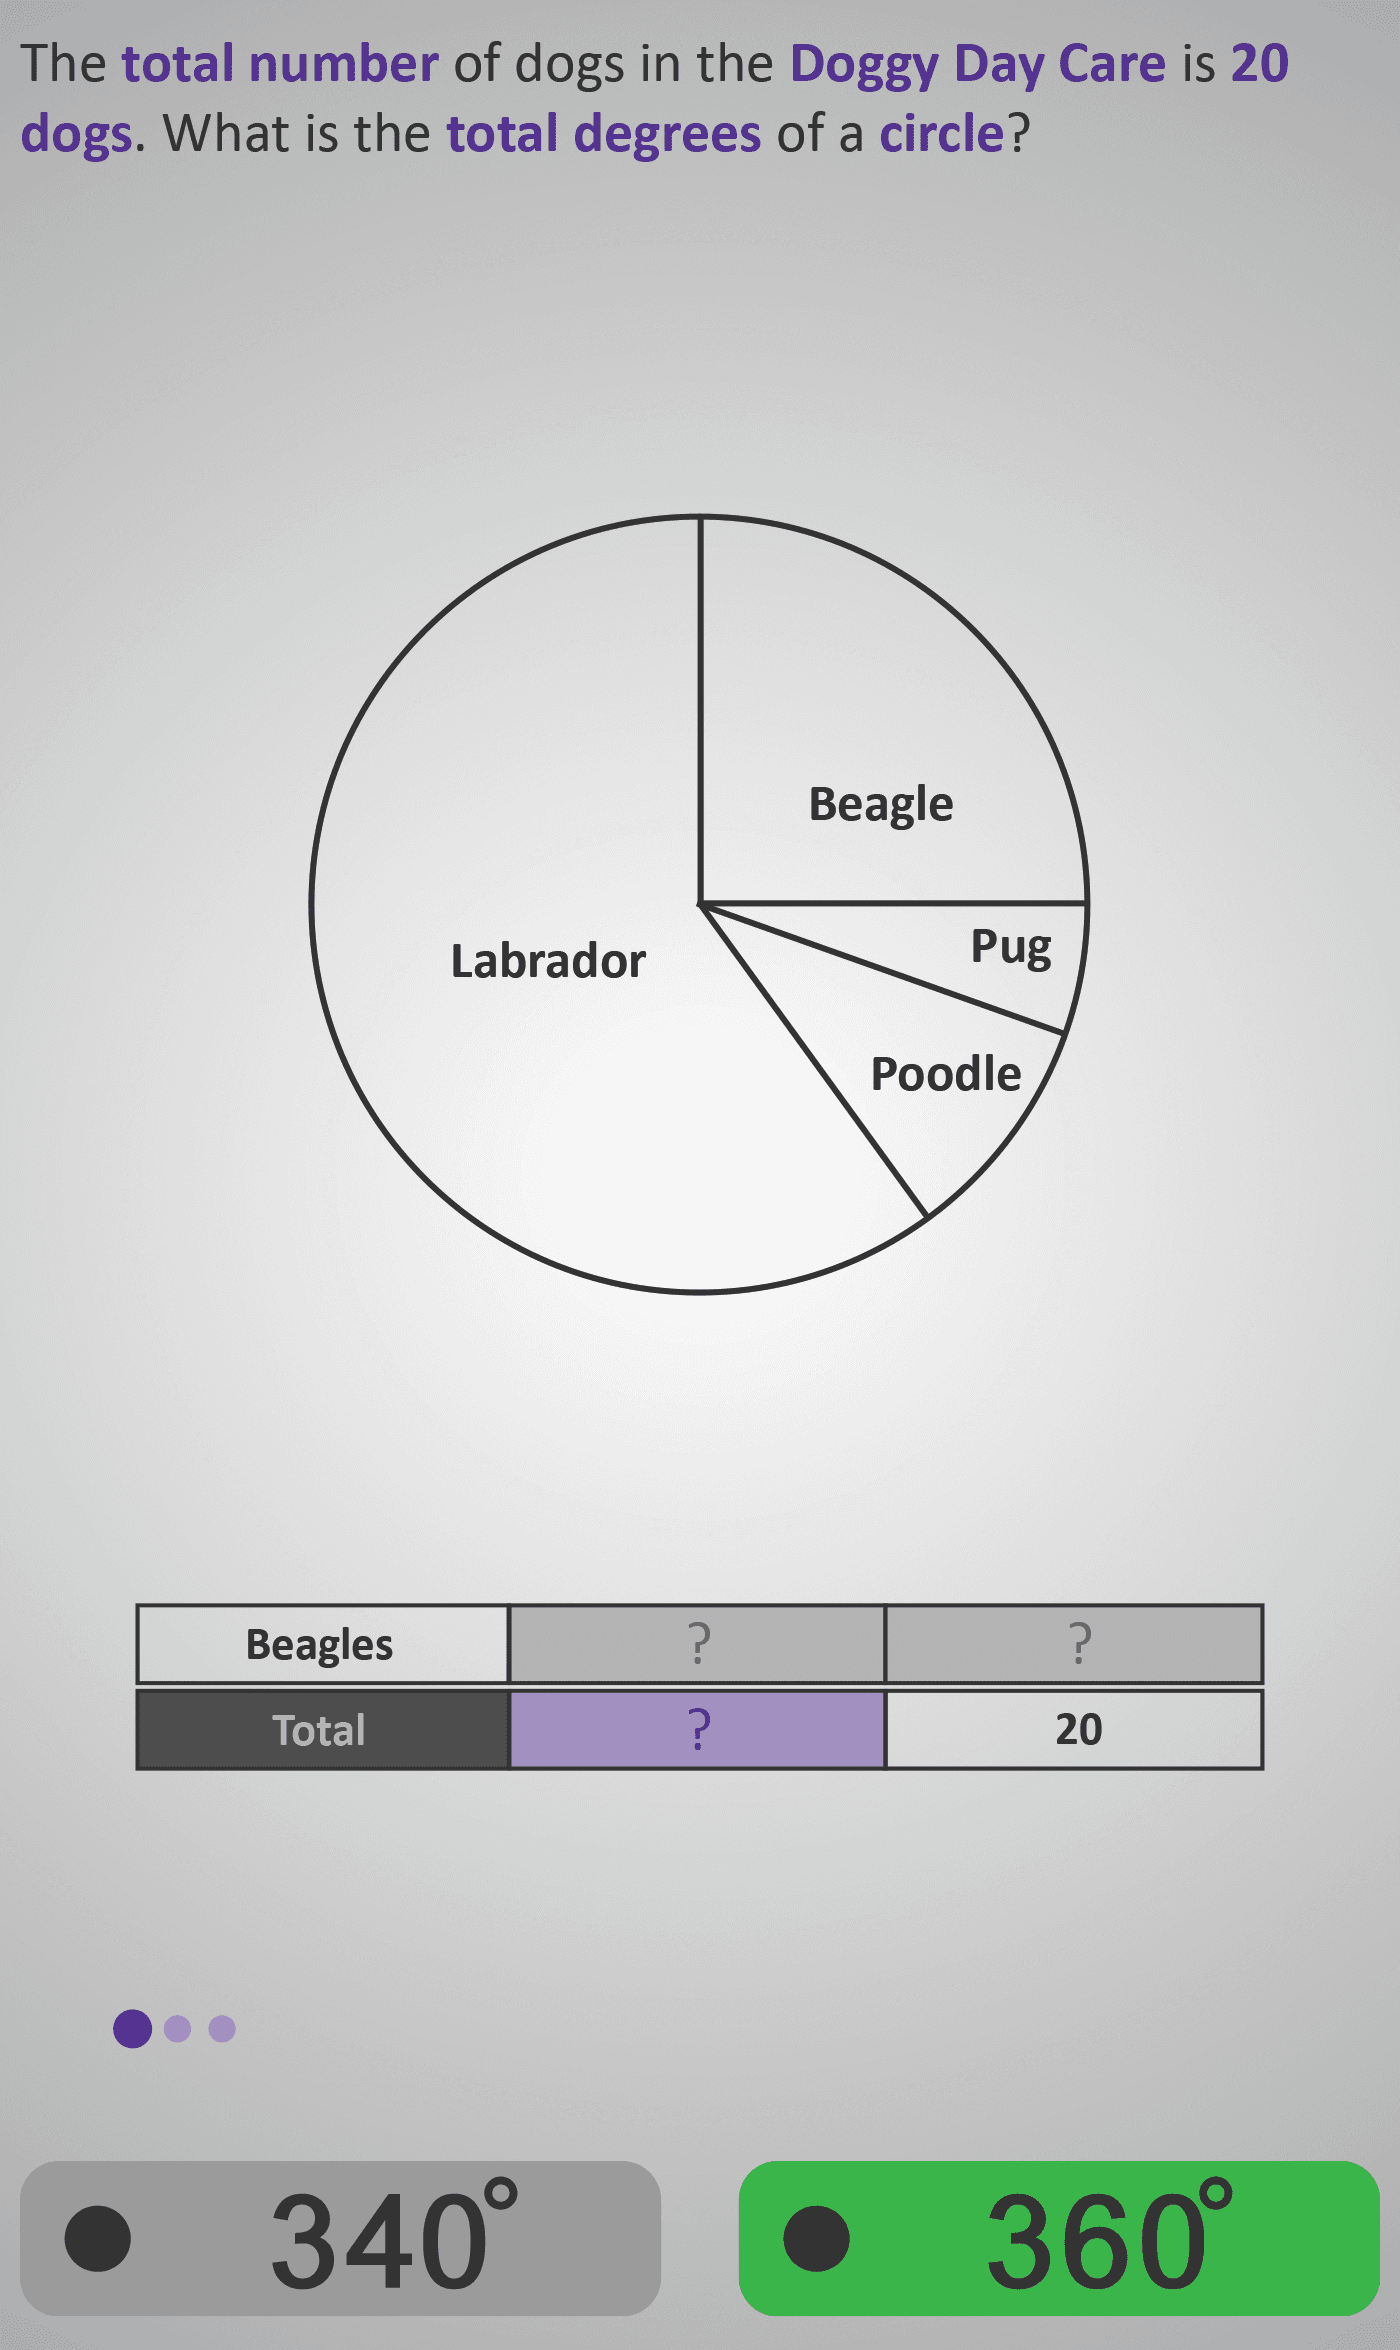
In this Phlow, learners connect the relationship between the total number of items and the total degrees in a circle. Using a “Doggy Day Care” scenario, they interpret a pie chart showing different dog breeds and reason through three key ideas:
- A full circle equals 360°.
- Each breed’s slice represents a fraction of the total number of dogs.
- The angle for a breed can be used to estimate or calculate how many dogs of that type are represented.
Students first recognise that all pie charts are based on 360°, regardless of what is being shown. They then estimate what a 90° sector looks like and reason that it represents one quarter of the total — for example, 5 out of 20 dogs. This visual reasoning helps generalise the link between fractions, proportions, and angles, preparing students to construct their own pie charts later.
By the end, learners understand how to interpret and calculate proportions using both estimation and proportional scaling, reinforcing the connection between data, angles, and fractions of a whole.
Prerequisite Knowledge Required
- Understanding that a circle has 360°.
- Knowing that fractions and percentages represent parts of a whole (e.g. ½ = 180°, ¼ = 90°).
- Familiarity with simple division and multiplication for scaling quantities.
- Awareness that each slice in a pie chart represents part of a total amount.
- Ability to interpret visual proportions (larger slice = more items).
Main Category
Data / Charts and Graphs
Estimated Completion Time
Approx. 3–4 minutes total (10–15 seconds per screen across 6 screens).
Cognitive Load / Step Size
Moderate — while the visual reasoning is intuitive, students must integrate multiple representations: numerical, visual, and proportional. Scaffolding across screens introduces each concept gradually — total degrees → estimation → calculation — helping to manage cognitive load.
Language & Literacy Demand
Medium — vocabulary such as total, degrees, estimate, approximately, represent, fraction, and proportion is introduced contextually. All terms are supported visually and reinforced through question phrasing.
Clarity & Design
- Consistent purple highlighting for key terms and numbers.
- Visual links between pie chart and data table strengthen understanding of proportional conversion.
- “Doggy Day Care” theme provides real-world context and engagement.
- Clear contrast between question, chart, and answer options ensures accessibility.
Curriculum Alignment
Irish Primary Curriculum / Junior Cycle Mathematics Learning Outcome 1.10
- Represent data using proportional parts of a circle.
- Estimate and calculate angles corresponding to data values.
- Relate fractions, percentages, and degrees in circular data representations.
Engagement & Motivation
High — the friendly, real-world theme makes the task enjoyable and relatable. Learners experience a sense of progress as they connect fractions and angles through estimation, calculation, and reasoning.
Error Opportunities & Misconceptions
- Confusing total number of items (e.g. 20 dogs) with total degrees (360°).
- Assuming all sectors are equal even when data differs.
- Failing to link 90° with one quarter of the total.
- Forgetting to scale proportionally when totals are not simple multiples.
These misconceptions are addressed through visual scaffolds, real examples, and guided reasoning prompts.
Transferability / Real-World Anchoring
High — students apply the same reasoning to interpret surveys, business charts, and media graphics. It lays the foundation for constructing pie charts and understanding percentages of a total.
Conceptual vs Procedural Balance
Balanced — students practise estimation and proportional calculation (procedural) while reinforcing conceptual understanding of how parts relate to the whole.
Learning Objectives Addressed
- Recognise that a full pie chart represents 360°.
- Estimate angles visually and link them to fractions of a circle.
- Calculate how many items correspond to a given sector.
- Understand the connection between fractions, angles, and proportions.
What Your Score Says About You
- Below 4: Review how 360° represents a full circle — then practise dividing it into halves (180°), quarters (90°), and thirds (120°).
- 5–7: You’re estimating angles well — focus on linking 90° = one quarter of the total.
- 8–9: Great understanding of proportional reasoning and visual estimation.
- 10 / 10: Excellent! You’ve mastered connecting data, fractions, and angles — you’re ready for Pie Chart 4A, where you’ll begin drawing pie charts from raw data.