Pie Chart 3F
Overview
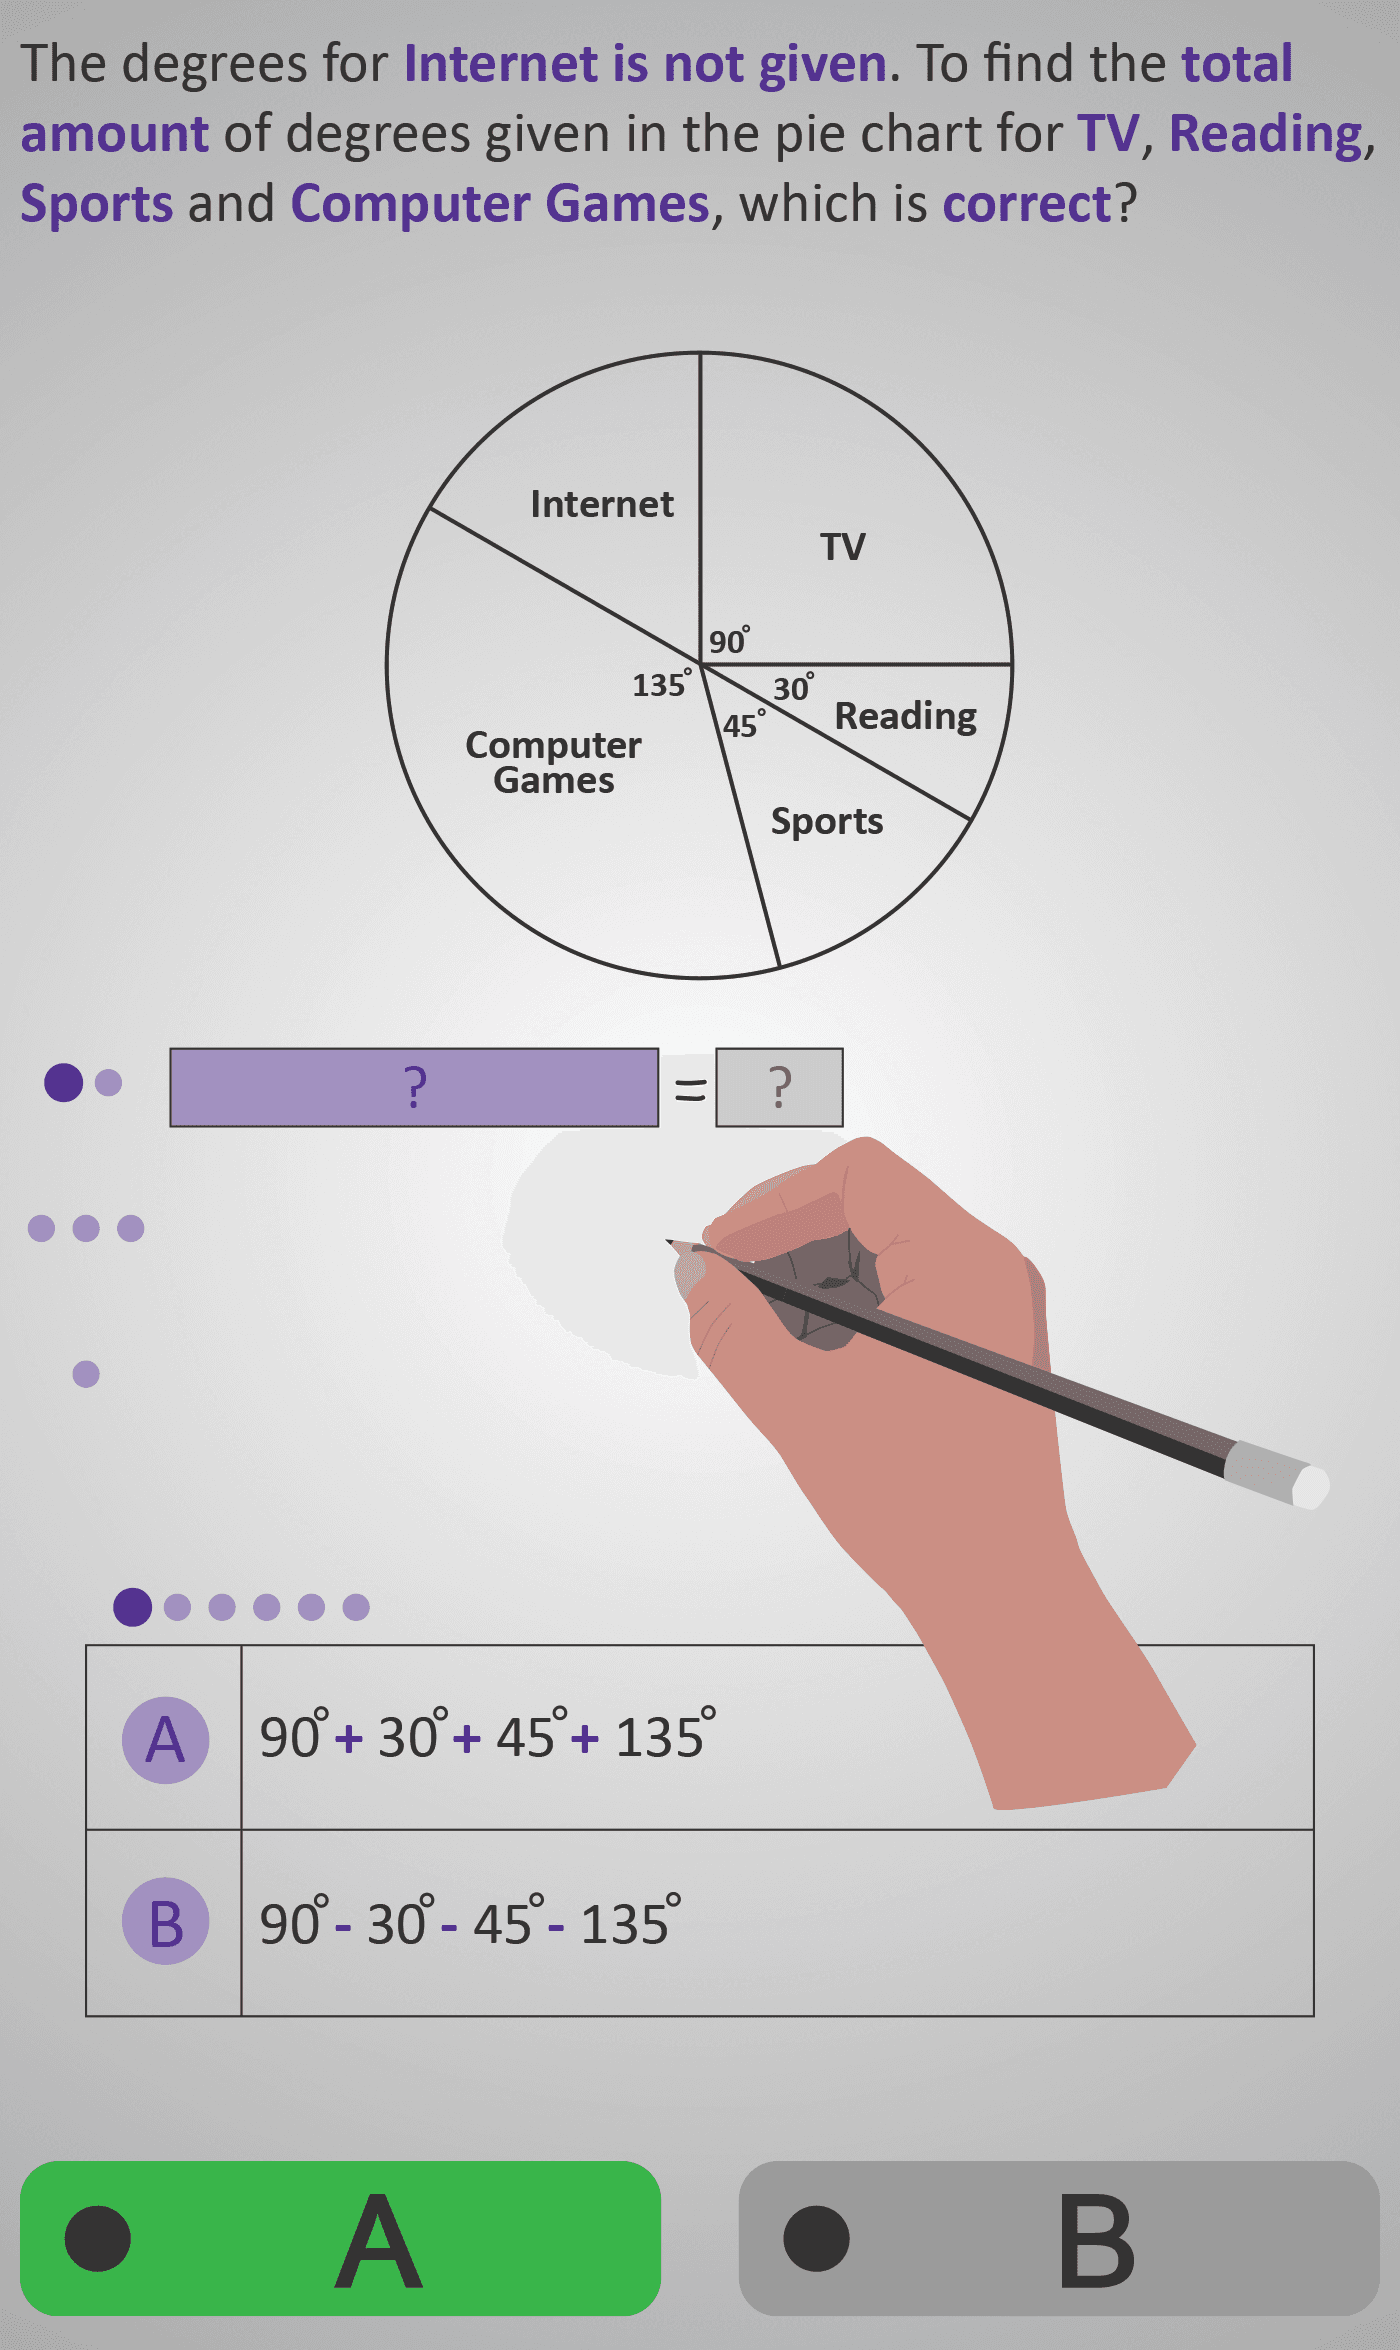
In this Phlow, learners apply their understanding of a full circle (360°) to determine the angle of a missing category in a pie chart. The example shows students’ favourite hobbies — TV, Reading, Sports, Computer Games, and Internet — where the Internet section’s angle is missing.
Students are guided through a clear, scaffolded reasoning sequence:
- Identify the known angles (90°, 30°, 45°, 135°) and add them together.
- Recognise that a pie chart totals 360°, representing the full group.
- Choose the correct operation — subtraction rather than division — to find what remains.
- Subtract the known total from 360° to calculate the missing section: 360° – 300° = 60°.
This step-by-step process connects arithmetic operations with proportional reasoning. Learners see that each sector represents a portion of a whole and that missing data can be deduced logically through calculation.
By the end, students confidently calculate unknown values in pie charts and can explain why subtraction is the correct operation for finding missing angles.
Prerequisite Knowledge Required
- Understand that a full circle has 360°.
- Recall how to add and subtract degrees accurately.
- Know that each sector represents part of a whole in a pie chart.
- Experience with interpreting pie charts from earlier Phlows (3A–3E).
- Familiarity with basic operations and symbols (plus, minus, divide).
Main Category
Data / Charts and Graphs
Estimated Completion Time
Approx. 5–6 minutes total, with clear reasoning steps across 6 screens.
Cognitive Load / Step Size
Moderate but cumulative — the Phlow builds step-by-step from identifying known values to choosing the correct operation and solving. Each screen isolates a single part of the process to keep reasoning manageable.
Language & Literacy Demand
Medium — vocabulary such as total, degrees, minus, divide, and missing angle is consistently reinforced. Purple highlighting of key terms and visual structure support comprehension.
Clarity & Design
- Hand-writing animation shows the reasoning and calculation in real time.
- Full pie chart shown repeatedly to reinforce the concept of 360° total.
- Subtraction structure (360° – 300° = 60°) introduced visually before symbolic form.
- Clean layout ensures focus on logical steps and avoids distraction.
Curriculum Alignment
Irish Primary Curriculum – Data Strand / Junior Cycle Learning Outcome 1.10
- Understand and use angles to represent proportions in a circle.
- Solve problems involving missing data in charts.
- Use addition and subtraction to verify completeness of data sets.
Engagement & Motivation
High — learners engage with interactive reasoning and see their logic unfold visually. The real-world “favourite hobby” context makes the reasoning relevant, and the satisfaction of finding the missing value reinforces mastery.
Error Opportunities & Misconceptions
- Confusing subtraction with division.
- Forgetting to total known angles first.
- Misreading 300° as the missing value instead of the known sum.
- Forgetting that 360° represents the complete data set.
The Phlow’s sequential question design corrects each misconception through guided feedback.
Transferability / Real-World Anchoring
High — this reasoning applies directly to survey data, reports, and charts in media or research. It builds readiness for higher-level tasks involving angles, ratios, and percentages.
Conceptual vs Procedural Balance
Strongly Procedural with Conceptual Reinforcement — students practise a clear method (add, then subtract) while understanding that 360° represents the complete whole.
Learning Objectives Addressed
- Recognise that a circle represents 360°.
- Add known sector angles to find the total given degrees.
- Use subtraction to find the missing angle in a pie chart.
- Understand why subtraction (not division) is the correct operation.
- Verify that all sectors together equal 360°.
What Your Score Says About You
- Below 4: Review how to total known degrees — remember, a full circle equals 360°.
- 5–7: Good reasoning! Focus on using subtraction to find what’s missing.
- 8–9: Excellent — you’re confidently applying step-by-step logic to pie chart problems.
- 10 / 10: Perfect! You’re ready for Pie Chart 4A, where you’ll construct pie charts from raw data using measured angles.