Pie Chart 3G
Overview
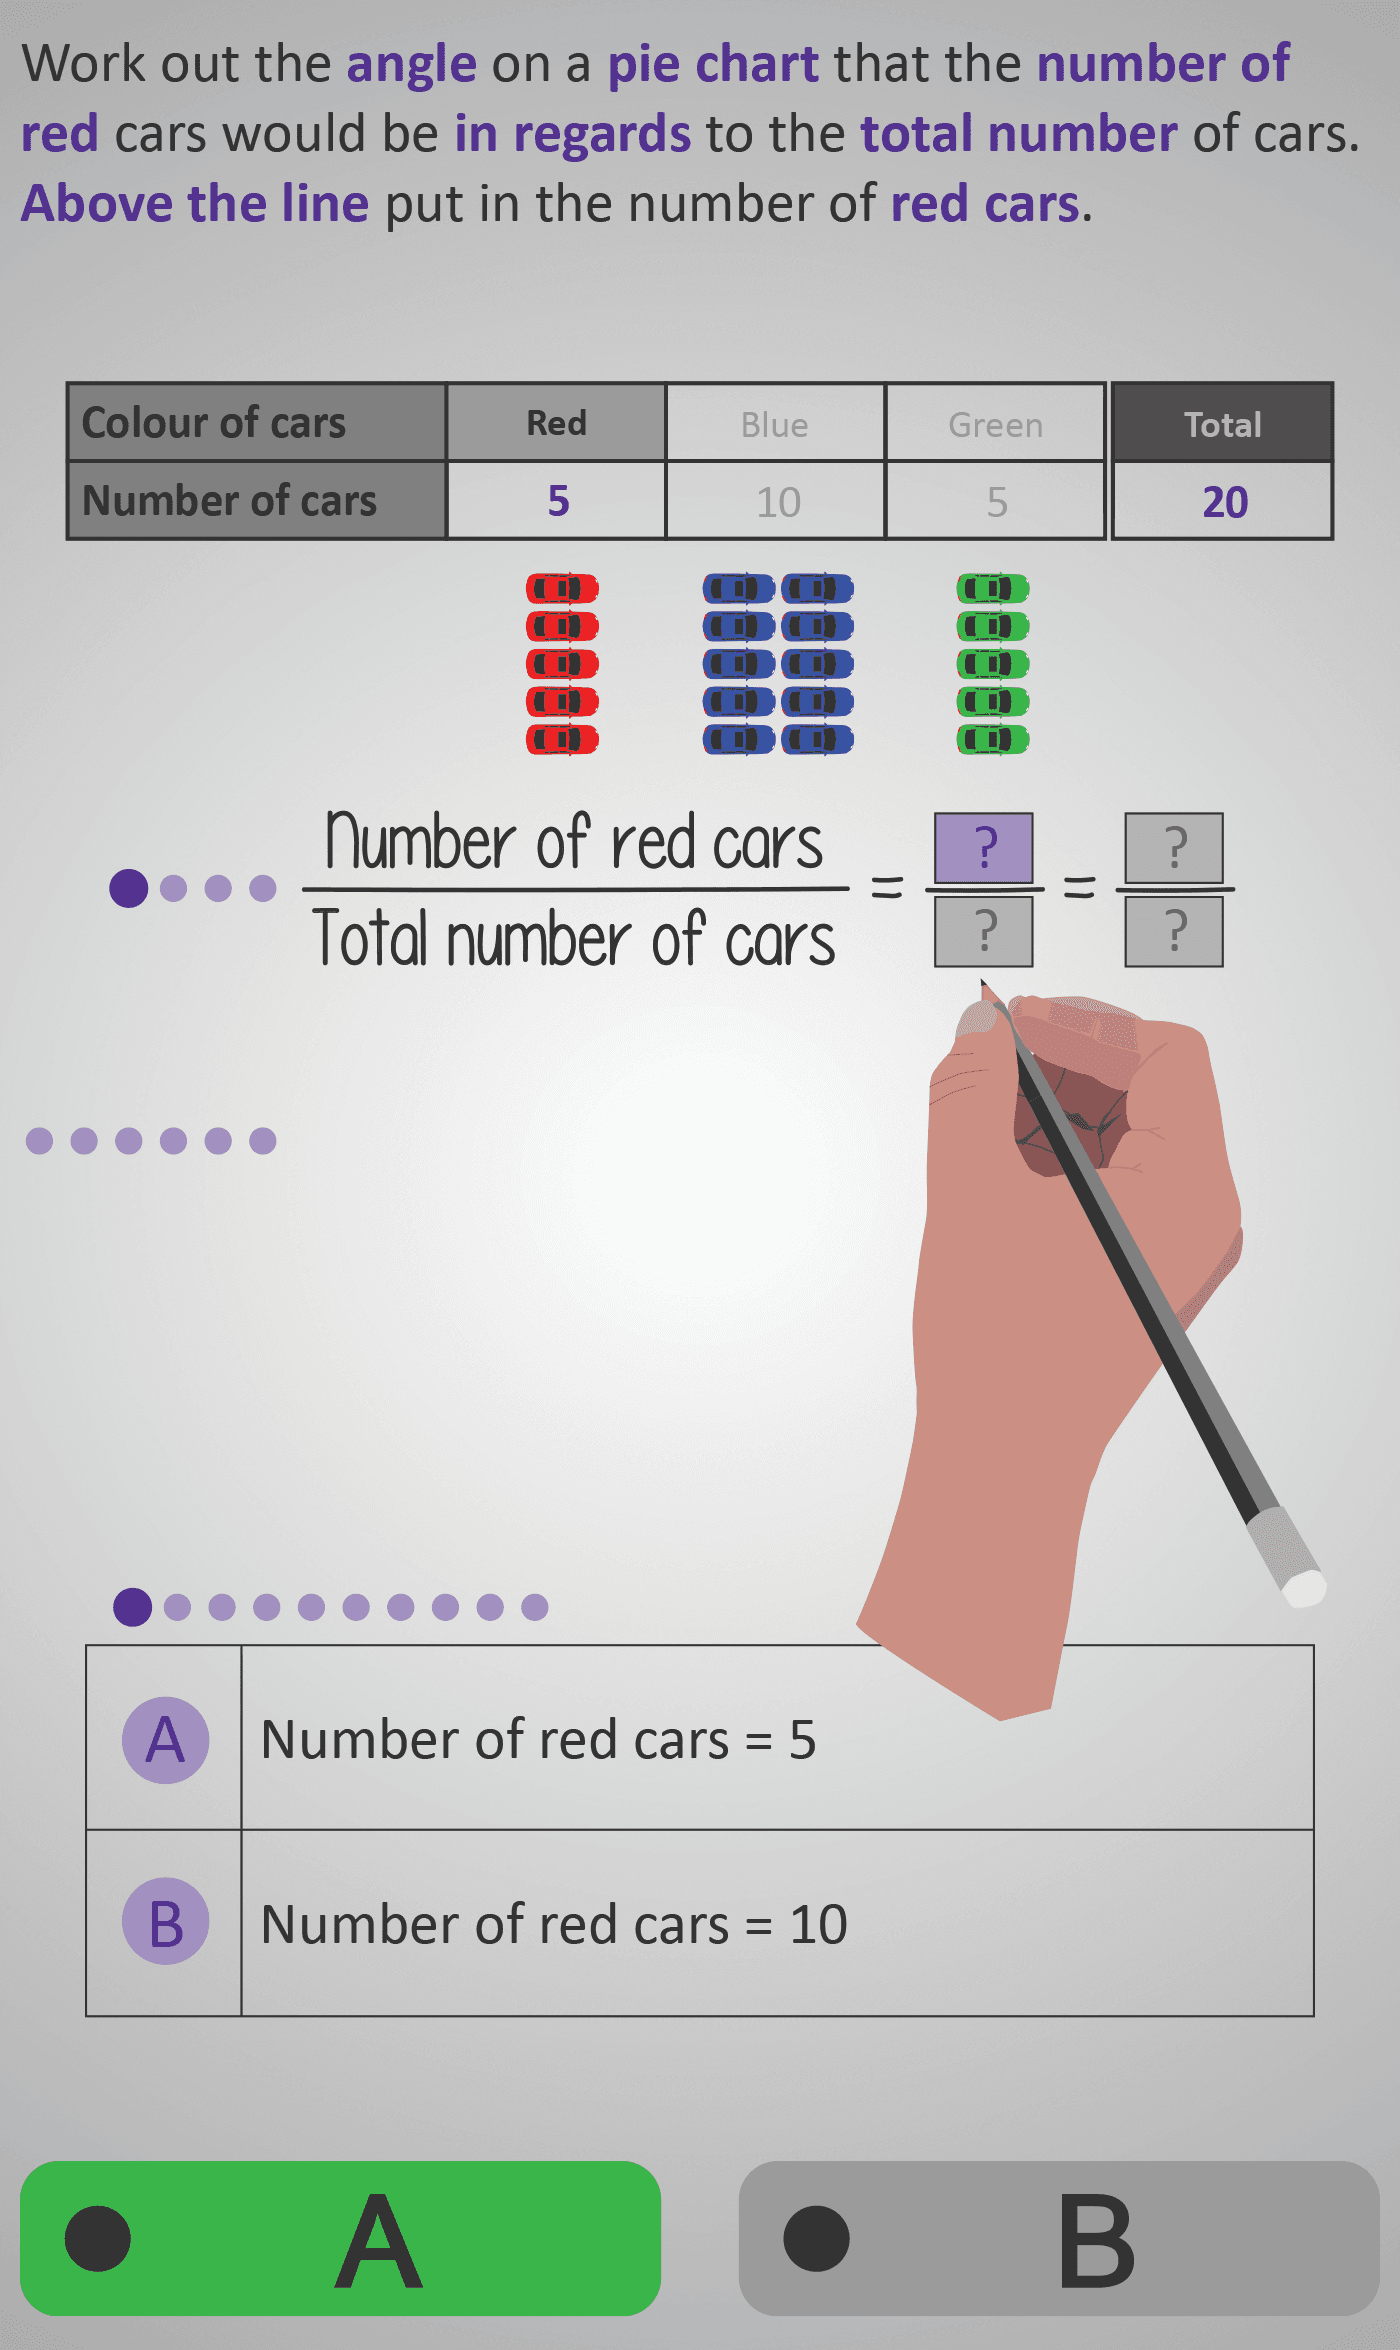
In this Phlow, learners discover how to use fractions to calculate the angle for each category in a pie chart. Using a colourful example with cars of different colours (red, blue, green), students are guided step by step through how data (number of cars) converts into a fraction of the total, and then into degrees on a circle.
Students start by:
- Identifying the total number of cars (20).
- Writing the number of red cars as a fraction of the total (5/20).
- Simplifying this fraction (1/4).
- Recognising that 1/4 of a circle equals 1/4 × 360°, and calculating the result (90°).
Each screen isolates a single part of this reasoning process — first forming the fraction, then simplifying it, then applying the multiplication. Learners also explore how fractions are multiplied and why dividing by 1 leaves the value unchanged. Through animation and repetition, students strengthen their grasp of the logic behind fraction × 360° as the method for finding a sector’s angle.
By the end, learners can confidently use this method to calculate any pie chart sector angle, linking proportional reasoning, arithmetic, and geometry within one coherent process.
Prerequisite Knowledge Required
- Understanding that a full circle has 360° in total.
- Basic understanding of fractions as parts of a whole.
- Ability to simplify fractions (e.g. 5/20 = 1/4).
- Knowledge of how to multiply and divide fractions.
- Familiarity with earlier Pie Chart Phlows (3A–3F) covering totals, angles, and proportions.
Main Category
Data / Charts and Graphs
Estimated Completion Time
Approx. 6–7 minutes total (8–10 short, guided screens).
Cognitive Load / Step Size
Moderate but highly scaffolded. Each cognitive step — forming, simplifying, substituting, and multiplying — is broken into clear stages. This gradual build supports sequential understanding without overloading working memory.
Language & Literacy Demand
Medium — mathematical terms include numerator, denominator, simplify, multiply, total, and angle. Colour-coded visuals (e.g., red, blue, green cars) help anchor meaning and reduce text dependency.
Clarity & Design
- Coloured car visuals make “parts of a whole” intuitive and concrete.
- Each mathematical step is shown visually and symbolically.
- “Handwriting” animation models the reasoning process clearly.
- Purple highlights draw attention to key mathematical actions (multiply, simplify, total degrees).
Curriculum Alignment
Irish Primary Curriculum – Data Strand / Junior Cycle Learning Outcome 1.10
- Represent data using proportional reasoning.
- Calculate the angle corresponding to a category using fractions.
- Connect fractions, proportions, and circle geometry.
Engagement & Motivation
High — the car theme is engaging and visually stimulating, while the step-by-step reasoning builds learner confidence. The connection between a simple fraction (¼) and a tangible result (90°) provides satisfying insight.
Error Opportunities & Misconceptions
- Mixing up numerator and denominator positions.
- Forgetting to simplify before calculating.
- Confusing multiplication with addition.
- Assuming the total circle equals 100° instead of 360°.
These are addressed through explicit questioning (“Do we multiply or add here?”) and visual modelling of the correct process.
Transferability / Real-World Anchoring
High — this skill is directly applicable to interpreting surveys, charts, and data visualisations. It lays the mathematical foundation for statistics, proportional reasoning, and geometry in higher levels.
Conceptual vs Procedural Balance
Balanced — learners understand that fractions represent proportions of a whole (concept)
while practising the procedural formula:
Angle = (Category Value ÷ Total Value) × 360°
Learning Objectives Addressed
- Express data as a fraction of a total.
- Simplify fractions accurately.
- Multiply a fraction by 360° to calculate a sector’s angle.
- Apply this reasoning to varied datasets (e.g., colours, hobbies, surveys).
What Your Score Says About You
- Below 4: Review how to form and simplify fractions — check which number goes above and below the line.
- 5–7: You’re correctly forming fractions — practise when to multiply by 360°.
- 8–9: Great reasoning! You’re confidently applying the formula to find sector angles.
- 10 / 10: Excellent mastery — you’re ready for Pie Chart 4A, where you’ll use your calculations to draw accurate pie charts with protractors.