Pie Chart 3H
Overview
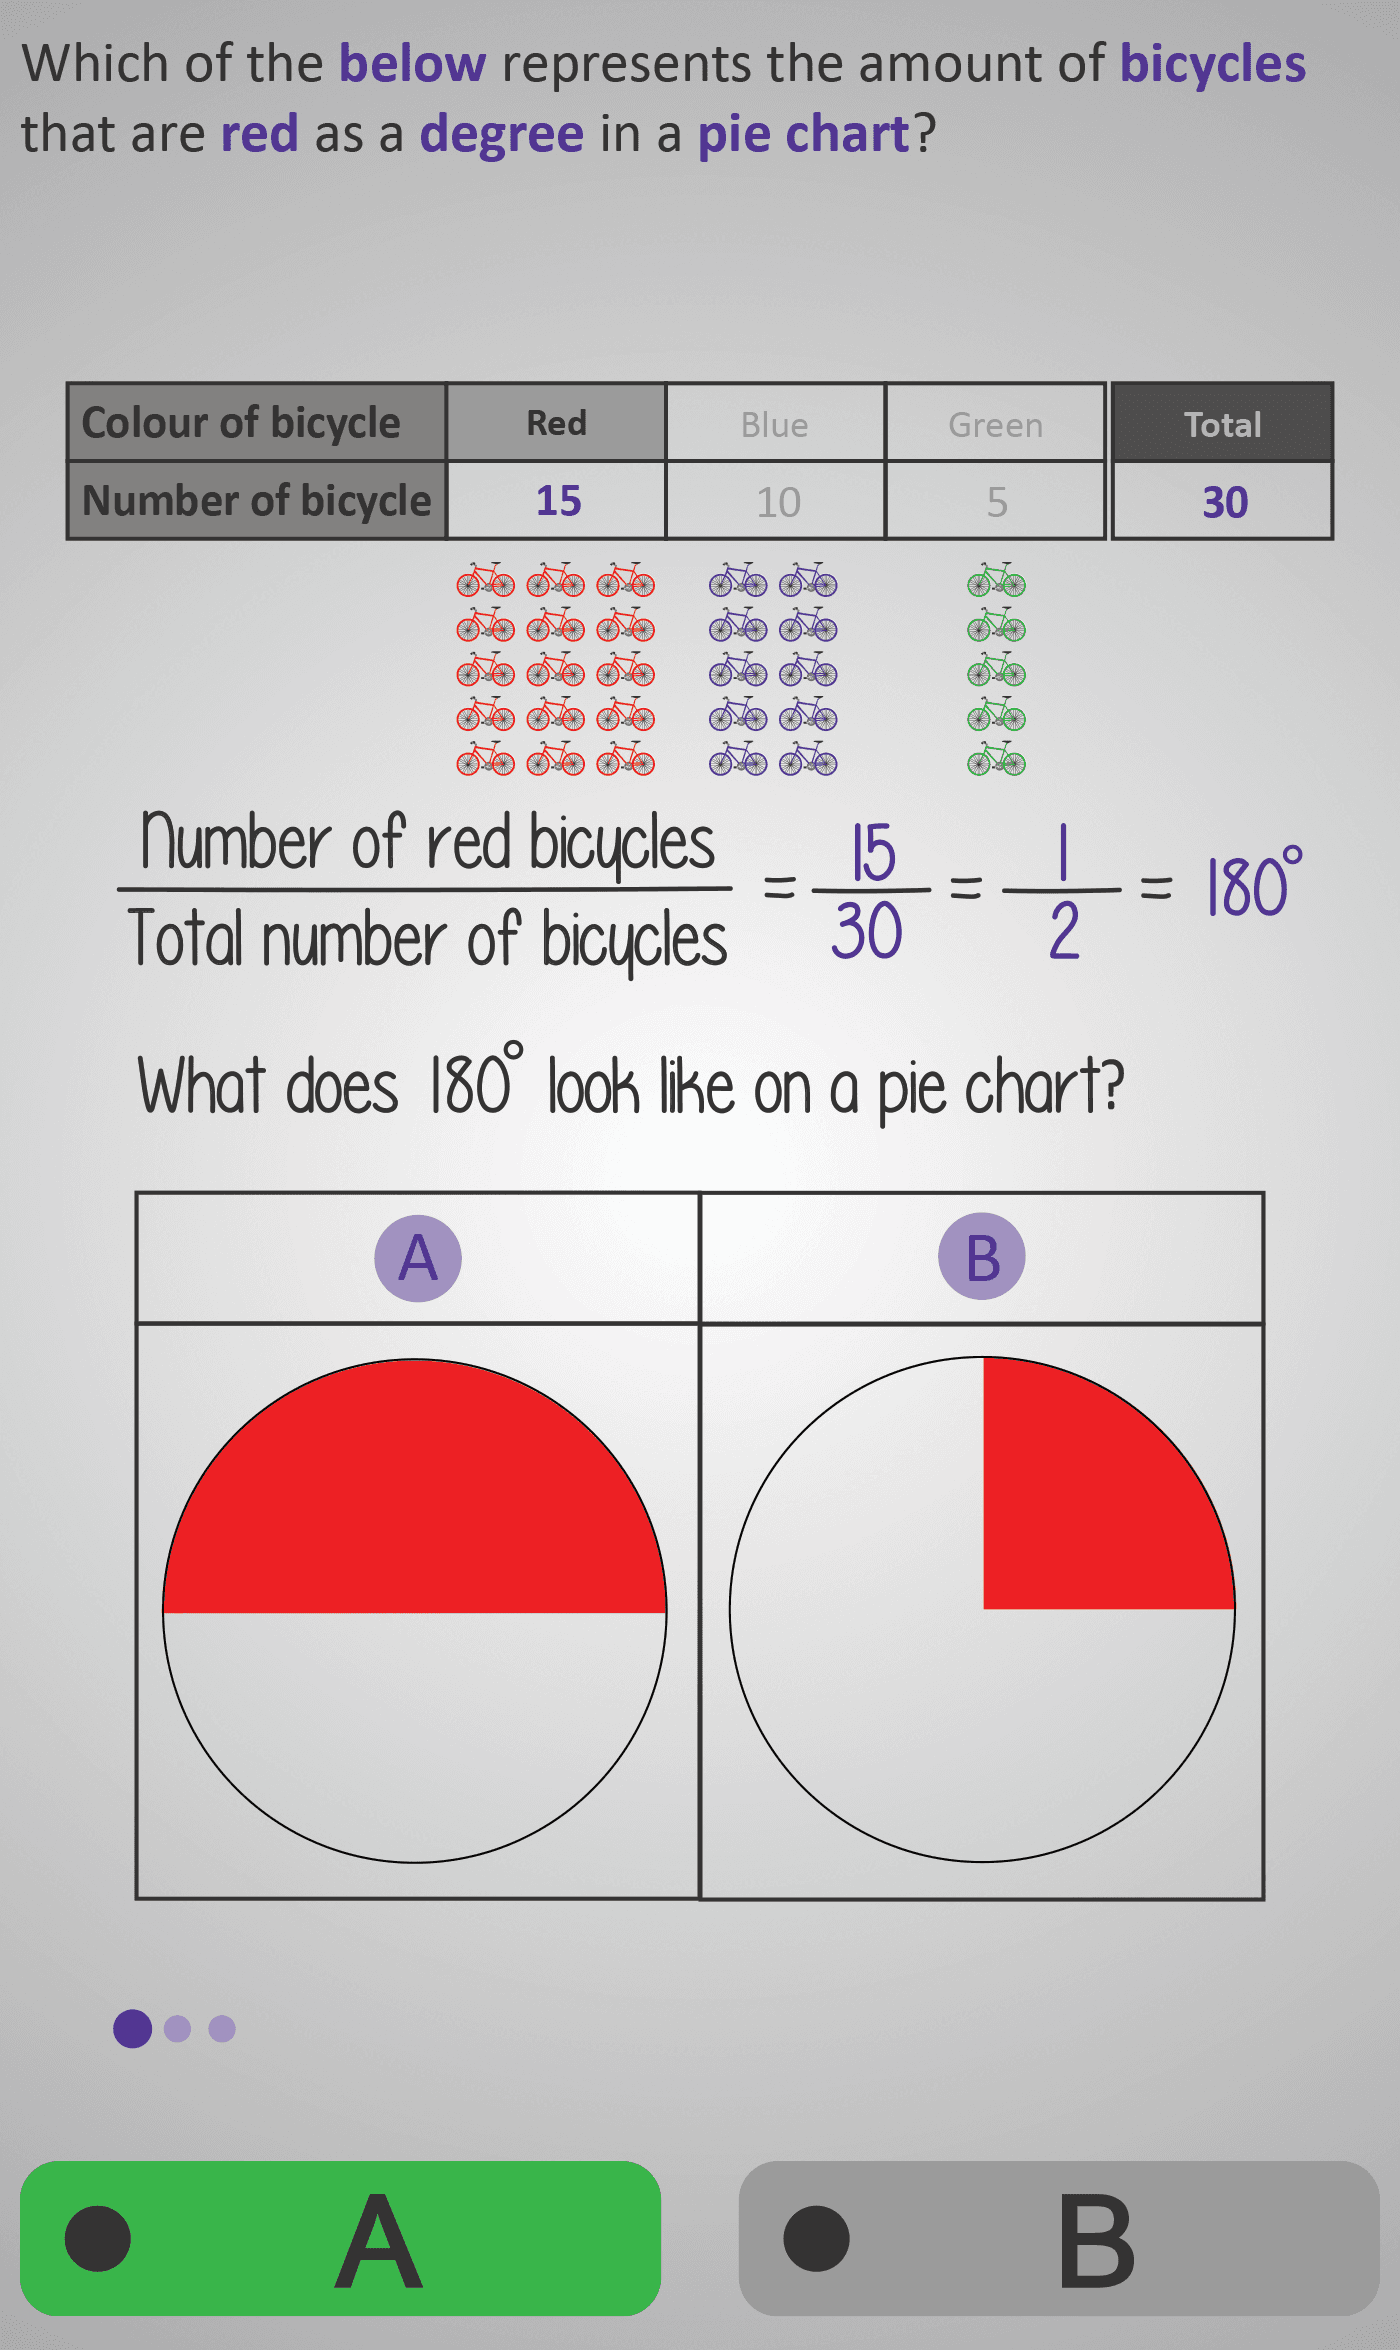
In this Phlow, learners bring together everything they’ve practised in previous lessons — fractions, totals, and 360° in a circle — to visualise data as pie chart sectors. Using an example about bicycle colours (red, blue, green), students calculate how many degrees each colour represents by converting from a fraction of the total:
- Red bicycles:
15/30 = 1/2 = 180° - Blue bicycles:
10/30 = 1/3 = 120° - Green bicycles:
5/30 = 1/6 = 60°
Each step encourages learners to interpret the fraction, convert it into degrees, and then identify which pie chart correctly shows that angle. By comparing visual options side by side, students develop an intuitive sense of how larger or smaller fractions appear as larger or smaller slices of a circle.
The interactive design reinforces the deep link between fractions, proportions, and angles, preparing learners for constructing full pie charts in later levels.
Prerequisite Knowledge Required
- Understanding that a circle has 360° in total.
- Knowing how to find fractions of a total.
- Ability to simplify fractions and convert between fractions and decimals if needed.
- Familiarity with multiplying fractions by whole numbers (e.g. 1/2 × 360°).
- Completion of earlier Phlows: Pie Chart 3E (Angles), 3F (Totals), and 3G (Fractions to Degrees).
Main Category
Data / Charts and Graphs
Estimated Completion Time
Approx. 5–6 minutes total (3–4 guided examples).
Cognitive Load / Step Size
Low–Moderate — each example focuses on a single fraction-to-degree conversion, with clear visual reinforcement. Comparing two pie charts per question keeps reasoning active but manageable, developing both analytical and visual intuition.
Language & Literacy Demand
Medium — students interpret words such as total, degree, fraction, represents, and angle. Colour-coded visuals (red, blue, green) minimise text dependency and strengthen understanding.
Clarity & Design
- Each fraction-to-degree calculation shown both numerically and visually.
- Side-by-side pie charts let students “see” proportional differences clearly.
- Consistent use of colour (red, blue, green) enhances recognition and memory.
- Minimal text and spacious layout reduce cognitive overload.
Curriculum Alignment
Irish Primary Curriculum – Data Strand / Junior Cycle Learning Outcome 1.10
- Convert data from fractions to degrees.
- Represent categories proportionally on a pie chart.
- Develop spatial understanding of proportional data representation.
Engagement & Motivation
High — the bicycle theme provides a familiar and engaging context. Students feel rewarded as their calculations align with the visual chart, linking abstract fractions to concrete images and fostering confidence.
Error Opportunities & Misconceptions
- Mixing up numerator and denominator positions.
- Forgetting to multiply by 360°.
- Misjudging what 120° or 60° sectors should look like visually.
These are corrected through visual feedback — comparing two charts (A vs B) and immediate reinforcement of correct reasoning.
Transferability / Real-World Anchoring
Strong — learners apply this skill to interpreting charts and data in reports, surveys, or media graphics. It builds transferable proportional reasoning for science, business, and geography.
Conceptual vs Procedural Balance
Balanced —
Procedural: converting fractions to angles using the formula
Angle = (Value ÷ Total) × 360°
Conceptual: recognising how different fractions appear as visual proportions of a circle.
Learning Objectives Addressed
- Convert categories of data from fractions to degrees.
- Estimate and verify sector sizes visually.
- Connect proportional reasoning to visual representation.
- Identify the correct pie chart for calculated angles.
What Your Score Says About You
- Below 4: Review how to multiply fractions by 360° and visualise smaller fractions on a circle.
- 5–7: You’re correctly interpreting fractions — practise matching your results to visual sectors.
- 8–9: Great spatial intuition — your fraction-to-angle understanding is strong.
- 10 / 10: Excellent! You’re ready for Pie Chart 4A, where you’ll construct full pie charts using a protractor and real data.