Probability 3E
Overview
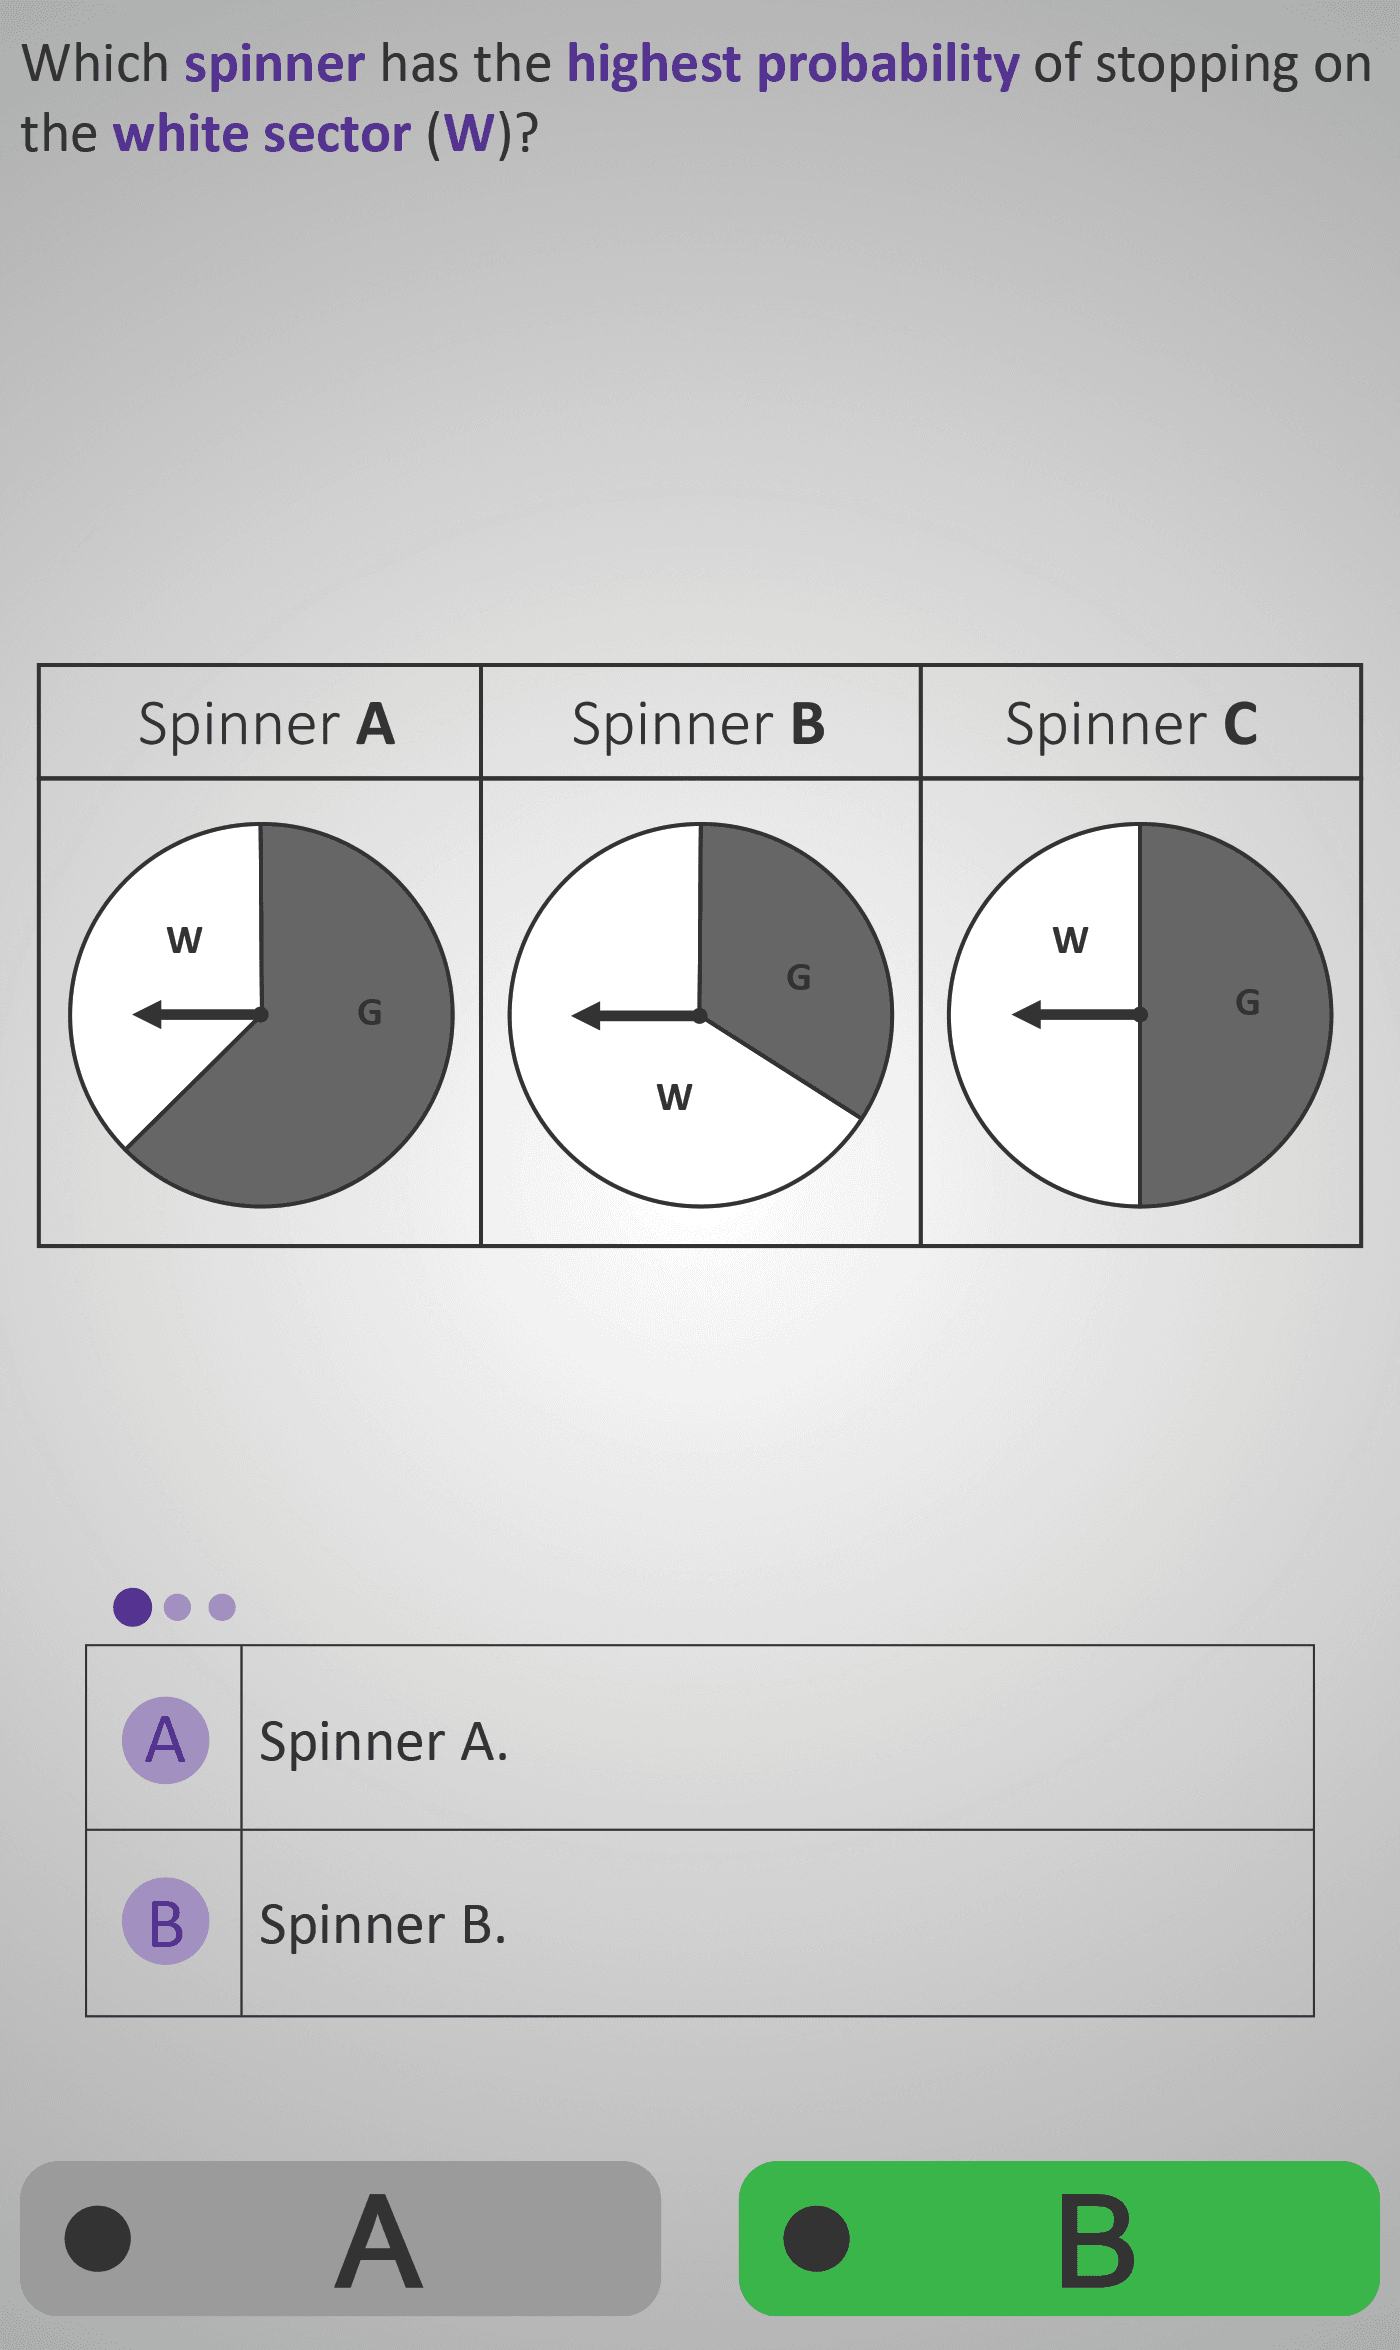
In this Phlow, learners move from calculating probabilities numerically to comparing probabilities visually. They are presented with three spinners (A, B, and C), each divided differently into white (W) and grey (G) sections. Students are asked: “Which spinner has the highest probability of stopping on the white sector (W)?”
By comparing the area of each white sector, they develop an intuitive understanding that larger areas represent higher likelihoods. In the next step, learners justify their choice: “Why does Spinner B have the highest probability of stopping on W?” They select the correct reasoning (“because Spinner B has a greater white area compared to the other spinners”), reinforcing conceptual understanding rather than memorised rules.
Finally, students connect theoretical probability to practical reasoning: “Spinner C was used 80 times. Estimate how many times it stopped on white (W).” This introduces experimental probability concepts, linking proportional reasoning to real-world frequency.
By the end of this Phlow, students can:
- Compare probabilities by visual size rather than number alone.
- Explain why one outcome is more likely than another.
- Estimate outcomes over multiple trials using proportional reasoning.
This marks a key transition point between theoretical and experimental probability.
Prerequisite Knowledge Required
- Understanding that probability depends on relative area or number of sections.
- Familiarity with probability terms: more likely, less likely, equally likely.
- Experience with fractions and proportional reasoning.
- Completion of Probability 3A–3D for probability structure and combined events.
Main Category
Data & Probability / Comparing and Estimating Probabilities
Estimated Completion Time
Approx. 6–7 minutes (three interactive comparison and reasoning screens).
Cognitive Load / Step Size
Low to Moderate — transitions gradually from visual comparison → reasoning → estimation. Consistent spinner design and colour cues minimise cognitive demand while strengthening intuitive understanding.
Language & Literacy Demand
Low — concise sentences supported by strong visuals. Key comparative terms (“greater”, “smaller”, “higher probability”) are reinforced through repetition and contextual examples.
Clarity & Design
- Each spinner is visually distinct and proportionally accurate.
- Colour contrast between white and grey enhances recognition.
- Sequential progression (identify → explain → estimate) mirrors authentic reasoning flow.
- Minimal text allows focus on visual logic and intuitive comparison.
Curriculum Alignment
Irish Junior Cycle Mathematics – Learning Outcome 1.11
- Compare the likelihood of events using visual and numerical methods.
- Explain why one event is more probable than another.
- Use probability to make and justify estimates in repeated trials.
Engagement & Motivation
High — the spinner visuals make probability feel playful and interactive. The estimation task connects mathematical reasoning to real-world experimentation, maintaining engagement and curiosity.
Error Opportunities & Misconceptions
- Confusing “greater area” with “greater number of sections.”
- Assuming all spinners are equally likely regardless of size.
- Errors in proportional estimation (e.g., 50% of 80 = 30).
Guided feedback and visual comparisons help correct misconceptions naturally.
Transferability / Real-World Anchoring
Strong — connects directly to real-world chance scenarios, games, and interpreting visual data (e.g., pie charts). Builds visual probability literacy essential for higher-level reasoning.
Conceptual vs Procedural Balance
Conceptual: understanding likelihood through visual comparison and reasoning.
Procedural: applying proportional thinking to numerical estimation.
Learning Objectives Addressed
- Compare and justify which outcomes are more likely.
- Relate probability to area and proportional reasoning.
- Estimate expected outcomes over multiple trials.
- Transition from qualitative to quantitative probability reasoning.
What Your Score Says About You
- Less than 15: Review how spinner area affects probability — focus on comparing white sections visually.
- 16–22: You can identify which outcome is more likely — practise explaining why.
- 23–29: Strong grasp of probability comparison — your reasoning is logical and well justified.
- 30 / 30: Excellent! You can compare, justify, and estimate probabilities confidently — ready for Probability Level 4, where you’ll explore fairness and test predictions using real experimental data.