Range 3
Overview
In this Phlow, learners are introduced to the concept of range as a measure of how much data values vary. The activity uses a real-world context — the number of push-ups done by six people — to make the concept tangible and relatable.
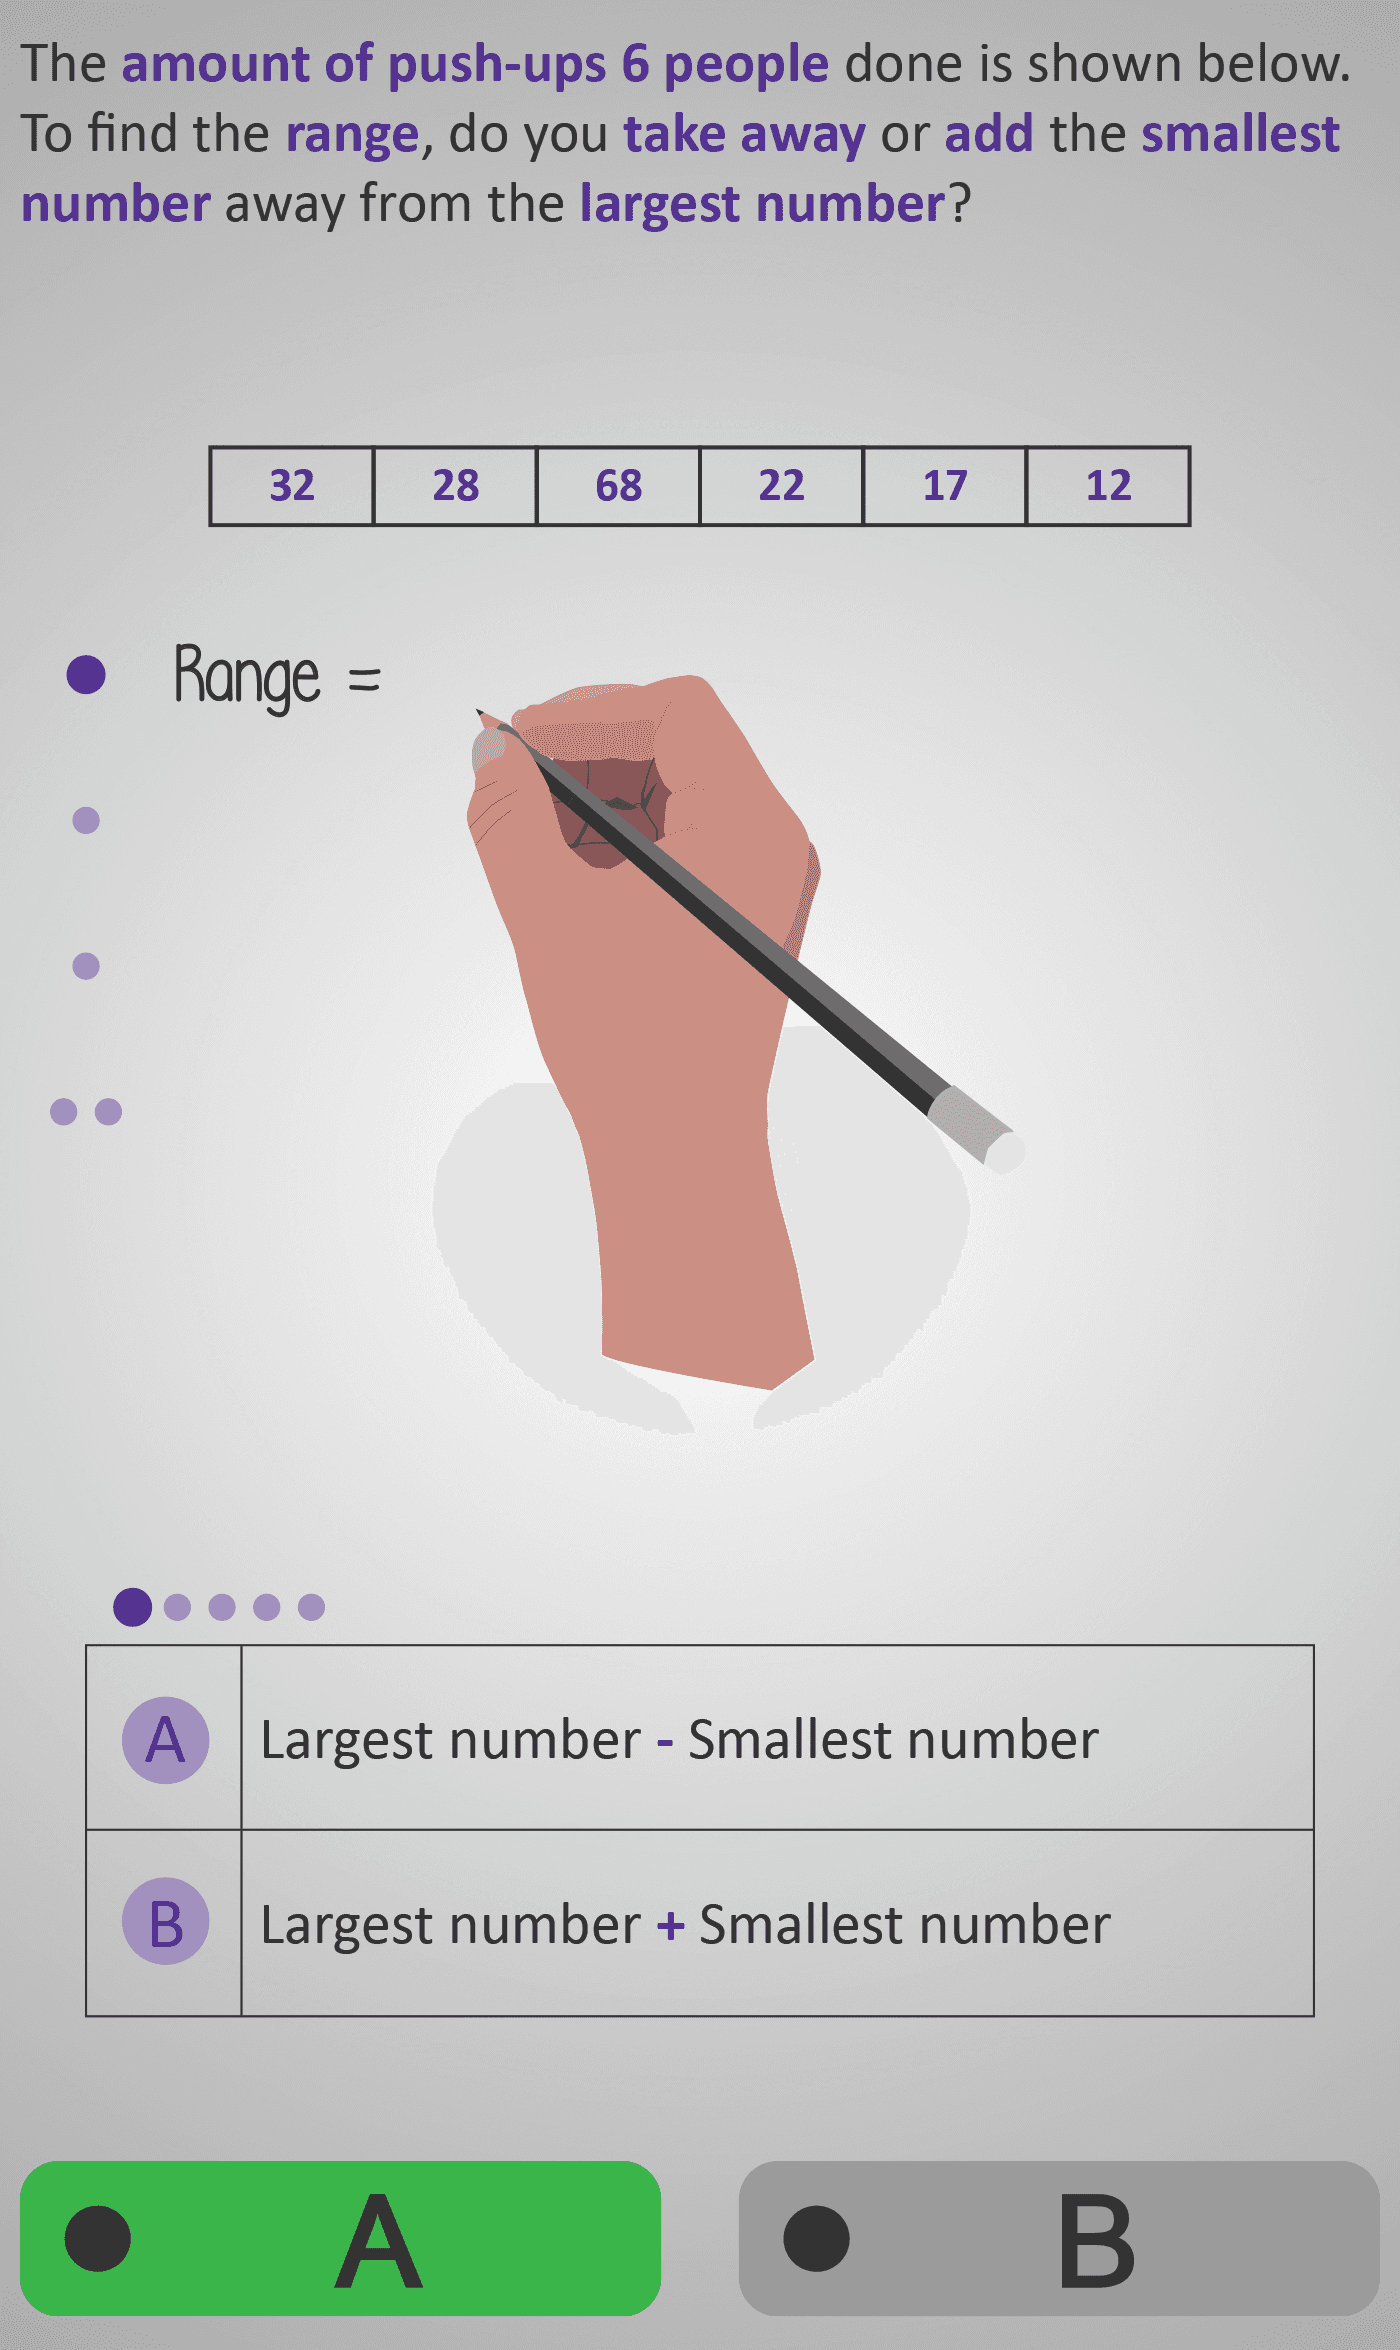
Students are shown the data set: 32, 28, 68, 22, 17, 12, and asked whether to add or subtract the smallest number from the largest to find the range. A visual of a hand writing “Range = Largest number – Smallest number” reinforces the rule.
Next, students identify the largest value (68) and smallest value (12) in the list. This builds data literacy — recognising extreme values in a set — before applying subtraction to calculate the range:
Range = 68 − 12 = 56
The visual step-by-step animation mirrors a teacher-led demonstration, showing each stage clearly — identify, substitute, subtract. By the end, students understand both what range represents and how to calculate it confidently and accurately.
This Phlow develops skills in:
- Comparing and interpreting numerical data.
- Performing subtraction with understanding.
- Recognising range as a key component of data handling.
It builds directly toward later Phlows involving averages (mean, median, mode) and interpretation of data spread at higher levels.
Prerequisite Knowledge Required
- Understanding of difference (subtraction).
- Ability to identify the largest and smallest numbers in a data set.
- Familiarity with comparing and ordering numbers.
- Prior completion of Range 2 is helpful but not essential.
Main Category
Statistics / Data Handling
Estimated Completion Time
Approx. 6–7 minutes (five visual reasoning steps).
Cognitive Load / Step Size
Low to Moderate — each step isolates a single idea: introducing the formula, identifying extremes, then performing subtraction. This structure ensures clarity and manageable progression.
Language & Literacy Demand
Moderate — clear, repeated phrasing such as “largest number minus smallest number” supports comprehension. Key mathematical vocabulary (range, subtract, largest, smallest) is visually reinforced.
Clarity & Design
- Simple visuals of boxed data enhance number recognition.
- Sequential layout supports procedural fluency (formula → identify → calculate).
- Purple highlights draw focus to each key operation.
- Handwriting animation mirrors real classroom explanation.
Curriculum Alignment
Irish Junior Cycle Mathematics – Learning Outcome 3.3
- Calculate the range of a data set.
- Identify and interpret maximum and minimum values.
- Use range to describe variability and compare data sets.
Engagement & Motivation
High — using real data (push-ups) makes the task relatable and enjoyable. Interactive questions provide instant feedback, encouraging mastery and confidence.
Error Opportunities & Misconceptions
- Confusing “range” with “average”.
- Adding instead of subtracting values.
- Misidentifying largest or smallest numbers.
These are corrected through explicit prompts and immediate visual guidance.
Transferability / Real-World Anchoring
Strong — connects easily to everyday contexts such as fitness, temperatures, or test scores. Students see how range provides quick insight into data variation.
Conceptual vs Procedural Balance
Conceptual: understanding what range measures about a data set.
Procedural: identifying extremes and performing subtraction accurately.
Learning Objectives Addressed
- Define range as the difference between the largest and smallest values.
- Calculate range using subtraction.
- Interpret range as a measure of data spread.
- Apply range to real-world data examples.
What Your Score Says About You
- Less than 15: Review how to identify largest and smallest numbers — subtraction, not addition, is key.
- 16–22: You understand the process — practise spotting extremes faster and checking subtraction.
- 23–29: You can confidently find and interpret range in data sets.
- 30 / 30: Excellent! You’ve mastered calculating range — ready for Range 4, where you’ll compare two data sets to judge which has greater variation.