Stem Leaf 3
Overview
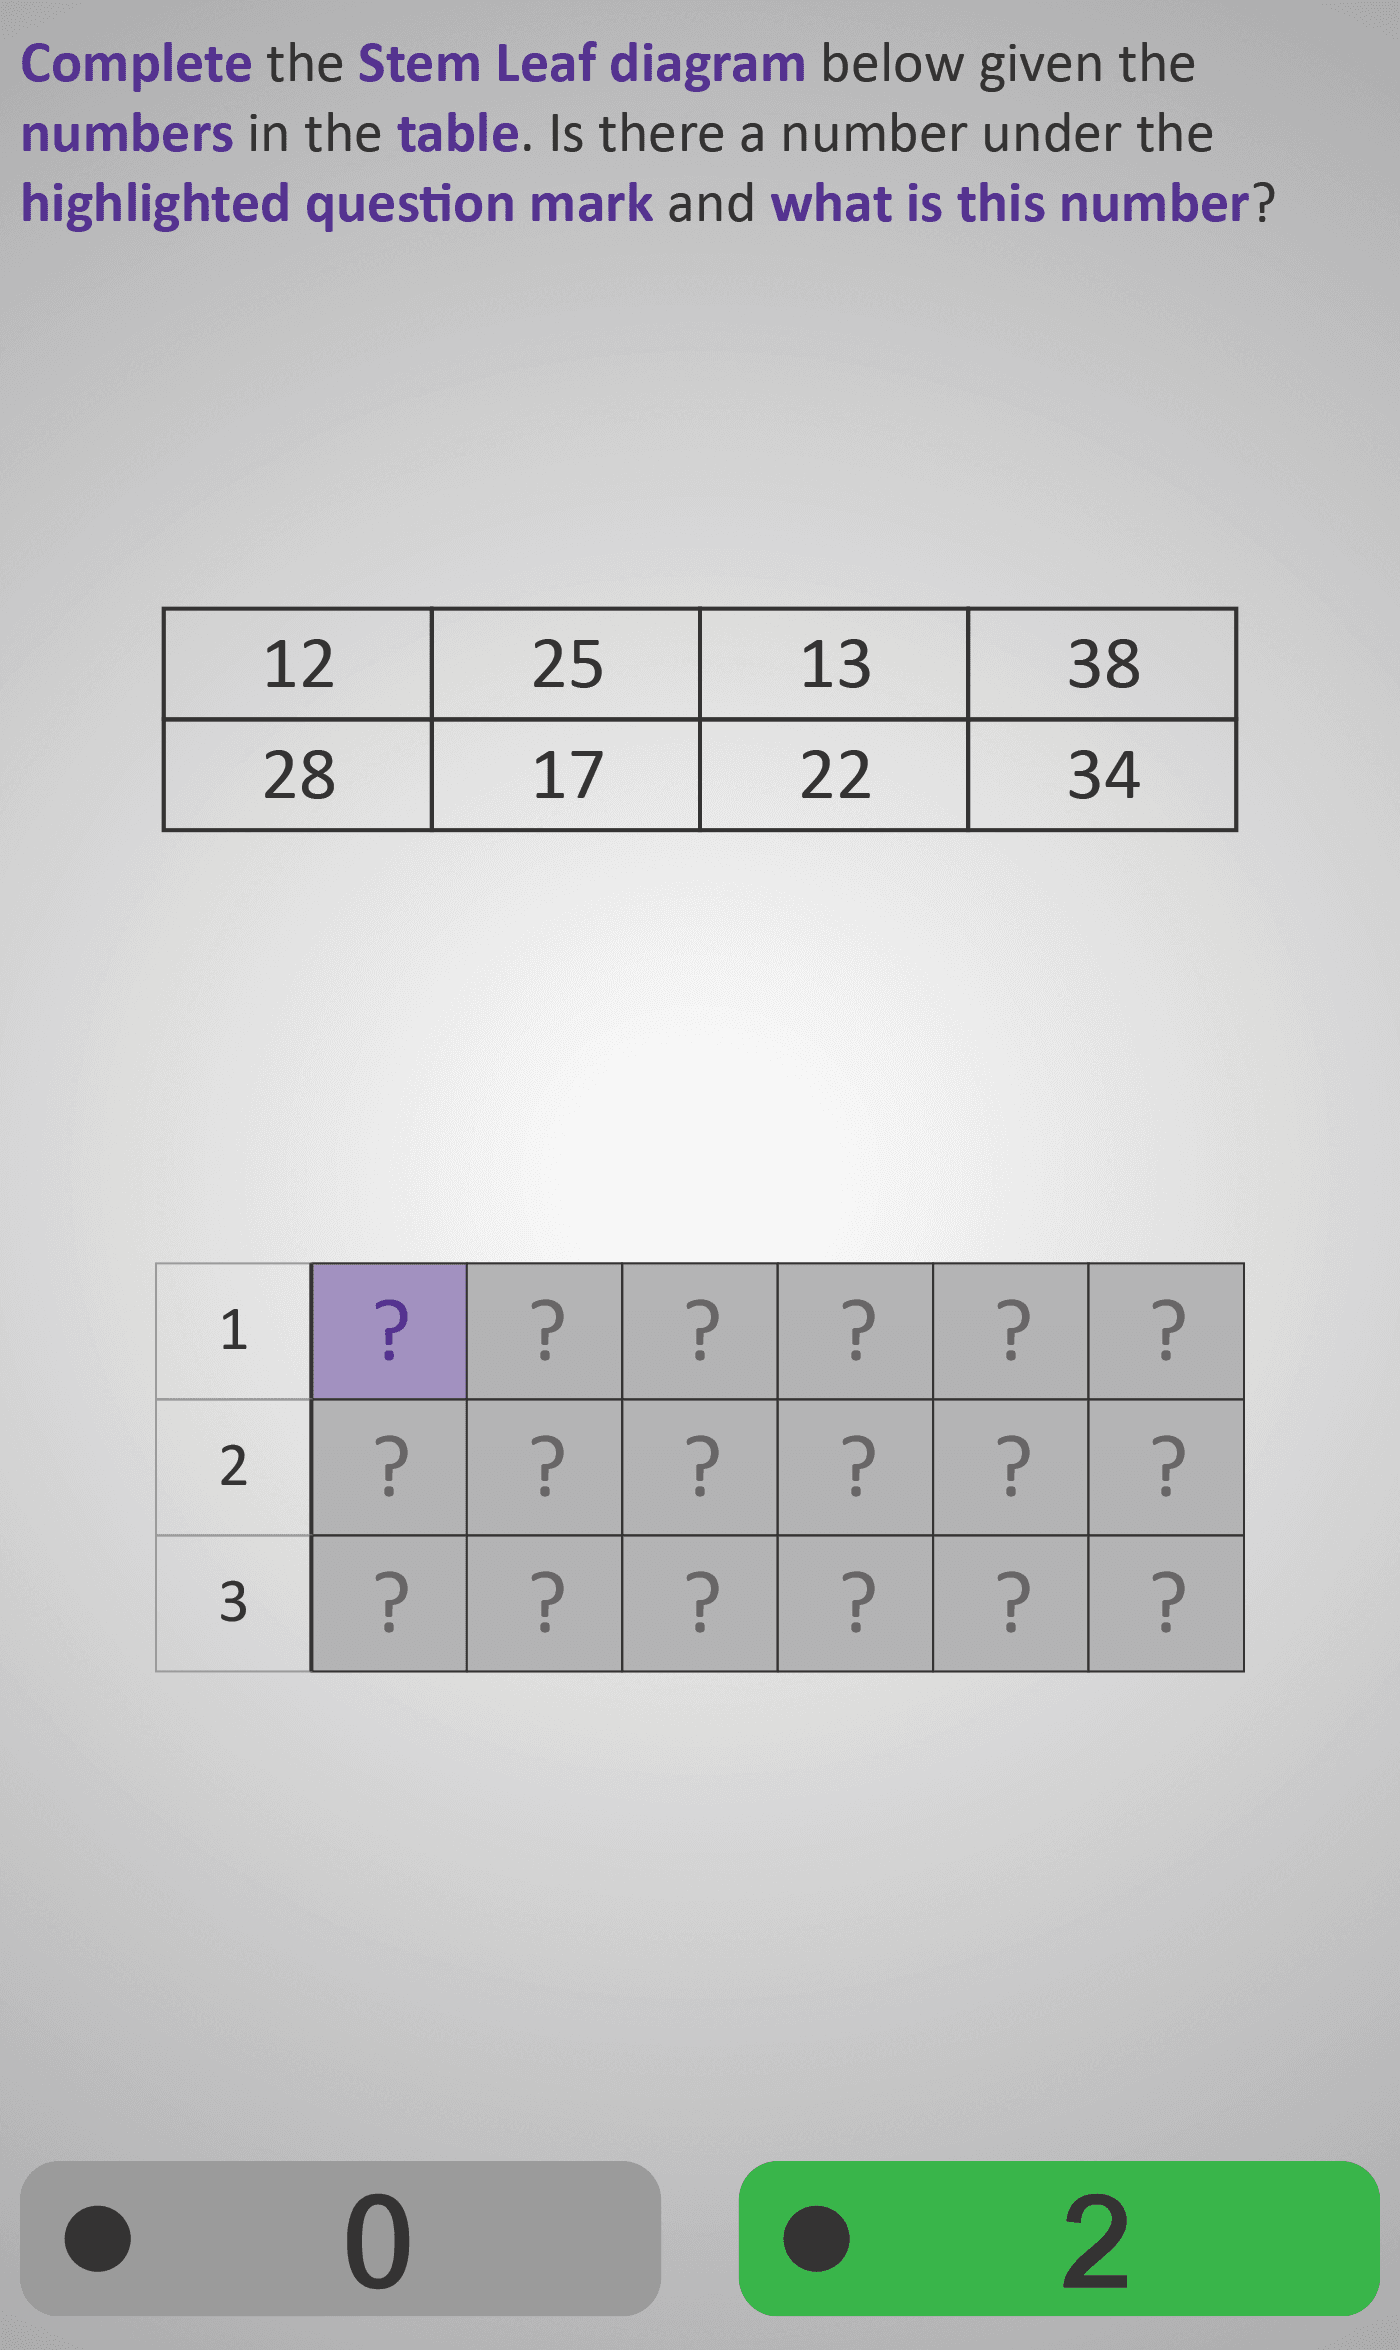
In this Phlow, learners interpret data from a table and transfer it accurately into a stem and leaf diagram. They are guided step by step through decisions such as which numbers belong under each stem and which digits appear as leaves. Each screen focuses on a single reasoning step — for example, checking if there’s a number in the 20s, or identifying the leaf that belongs beside a stem of 1.
Students work with two-digit numbers such as 12, 13, 17, 22, 25, 28, 34, 38. This exercise strengthens understanding of how data is grouped by place value and displayed in an organised visual format.
By completing each part of the diagram, learners connect raw data (numbers in a table) to a structured statistical representation. This process supports accurate ordering, pattern recognition, and visual reasoning — key foundations for later topics such as averages, quartiles, and data comparison.
Prerequisite Knowledge Required
- Understanding of place value (tens and units).
- Ability to read and sort two-digit numbers by their tens digit.
- Familiarity with the stem-and-leaf format (e.g., “1 | 2” represents 12).
- Prior completion of:
- Stem Leaf 1 – Understanding Diagram Structure
- Stem Leaf 2 – Reading Data from a Stem and Leaf Chart
Main Category
Statistics / Data Representation
Estimated Completion Time
Approx. 10–15 seconds per question (30 questions total). Total time: 5–7 minutes.
Cognitive Load / Step Size
Moderate — each question isolates one placement decision, allowing students to focus on how numbers map between table and diagram. The repetition across stems reinforces place value reasoning and pattern recognition without cognitive overload.
Language & Literacy Demand
Low to Moderate — clear, directive phrasing (“Does this number belong under the stem 2?”). Vocabulary such as stem, leaf, and table is reinforced with visuals. Success depends primarily on numerical reasoning, not text comprehension.
Clarity & Design
- Alternating highlights draw focus to relevant numbers and stems.
- Clean, authentic diagram mirrors standard classroom layout.
- Two-panel design (table above, diagram below) supports logical mapping.
- Sequential completion of stems promotes visual satisfaction and understanding.
Curriculum Alignment
Strand: Statistics
Strand Unit: Representing Data
- Organise and display data using a stem and leaf plot.
- Interpret and construct data representations accurately.
- Connect raw numerical data to graphical forms.
- (Aligned with Junior Cycle Mathematics Learning Outcomes 2.19 and 2.20.)
Engagement & Motivation
High — the puzzle-like process of placing numbers correctly keeps students engaged. Each completed row provides visual confirmation and progress, reinforcing accuracy through satisfaction and instant feedback.
Error Opportunities & Misconceptions
- Confusing tens and units (e.g., writing 13 as 3 | 1 instead of 1 | 3).
- Forgetting to order leaves in ascending order.
- Missing values from the table due to scanning or attention errors.
The step-by-step design corrects these naturally, with stems being revealed progressively to reinforce correct placement.
Transferability / Real-World Anchoring
Strong — this skill applies directly to data interpretation in statistics, assessments, and daily life. Understanding stem-and-leaf diagrams prepares learners for topics like median, range, mode, and comparing grouped data.
Conceptual vs Procedural Balance
Conceptual: Understanding how the diagram groups and orders data.
Procedural: Accurately transferring and recording values.
The Phlow maintains balance to ensure comprehension and accuracy.
Learning Objectives Addressed
- Identify which numbers belong under specific stems.
- Transfer data correctly from a table to a stem-and-leaf diagram.
- Interpret completed diagrams to understand data distribution.
- Develop accuracy and order in data representation.
What Your Score Says About You
- Below 15: Review matching tens digits to stems — start with smaller data sets.
- 16–22: You can identify stems and leaves — focus on accuracy and order.
- 23–29: Strong! You can now describe patterns and find medians in the data.
- 30 / 30: Excellent! You’re ready for Stem Leaf 4, where you’ll compare two data sets and analyse variation between them.