Survey 3C
Overview
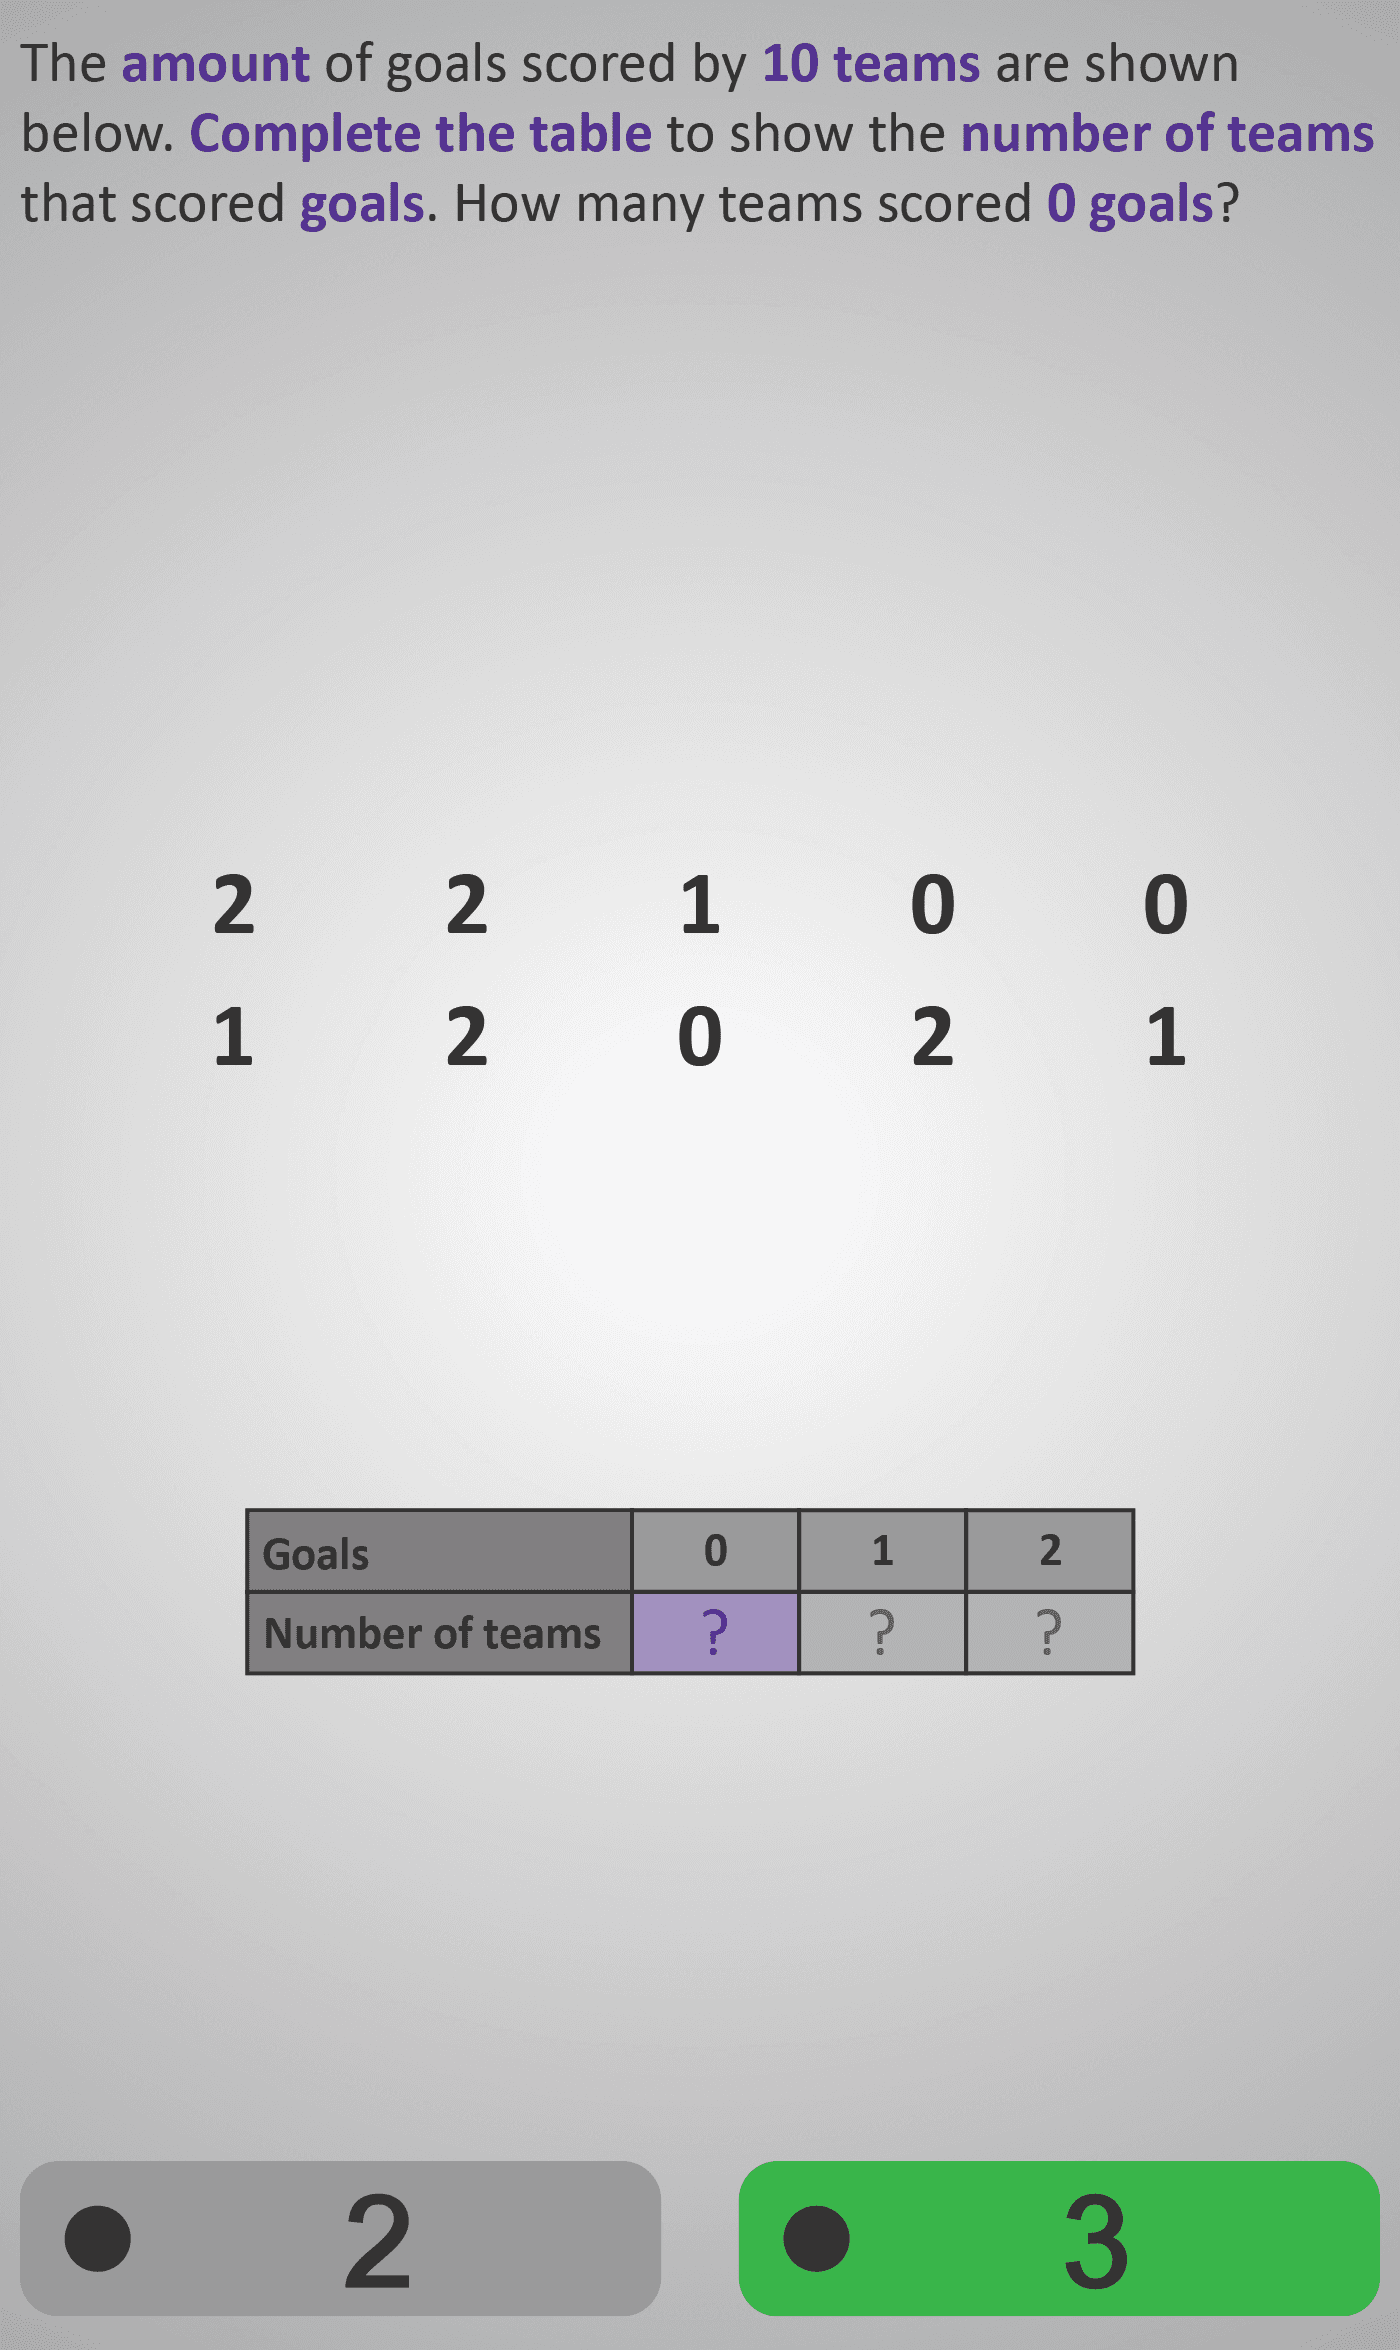
In this Phlow, learners explore how raw data — a list of numbers — can be organised into a frequency table. The scenario shows the number of goals scored by 10 teams in a tournament. Students are asked to count how many teams scored 0, 1, or 2 goals and to record these counts in a table.
The Phlow progresses step by step:
- First, students identify how many teams scored 0 goals.
- Then, they find how many scored 1 goal.
- Finally, they count how many scored 2 goals.
Each question isolates one value, encouraging careful visual scanning, counting accuracy, and pattern recognition. The design reinforces that a frequency table summarises data — transforming long lists into a clear, structured format that makes patterns easy to see.
By the end of the activity, learners understand the purpose and construction of a frequency table, can calculate frequencies accurately, and are ready to apply these skills to represent data graphically (e.g., bar charts or pie charts).
Prerequisite Knowledge Required
- Understanding that each number in a list represents one data point (e.g., one team’s score).
- Ability to count and compare quantities accurately.
- Awareness that a frequency table groups identical values together to show how often they occur.
- Prior familiarity with:
- Survey 2 or 3A – Reading and adding values from a table
- Bar Chart 1–2 – Comparing quantities visually
Main Category
Statistics / Data Handling
Estimated Completion Time
Approx 10–12 seconds per question (30 total). Total time: 5–6 minutes.
Cognitive Load / Step Size
Moderate — each question requires visual scanning and counting within a small data set, developing precision and focus. The gradual build-up (0-goal → 1-goal → 2-goal) supports working memory and reinforces consistent reasoning.
Language & Literacy Demand
Low — sentences are short and visually supported by the data list. Keywords such as goals, teams, and table are repeated, with direct links between text and visuals to ensure understanding.
Clarity & Design
- The list of raw scores is presented clearly in two rows for easy scanning.
- The frequency table includes shaded headers and defined cells for clarity.
- Sequential highlighting of the active number (0, 1, or 2) directs learner focus.
- Consistent visual layout maintains clarity and minimises distraction.
Curriculum Alignment
Strand: Statistics
Strand Unit: Representing and Interpreting Data
- Organise data using frequency tables.
- Recognise the link between raw data and summarised forms.
- Identify patterns and draw conclusions from summarised data.
- (Aligned with Junior Cycle Mathematics Learning Outcomes 2.19, 2.20.)
Engagement & Motivation
High — the sports context (goals scored by teams) is relatable and engaging. The counting task mirrors real-world scorekeeping, providing a natural motivation to participate while reinforcing key data handling skills.
Error Opportunities & Misconceptions
- Miscounting data items (skipping or double-counting).
- Mixing up categories (e.g., counting 2s as 1s).
- Forgetting that each number represents one team, not a total.
Visual feedback and clear highlighting ensure misconceptions are corrected step by step.
Transferability / Real-World Anchoring
Strong — this skill is applicable in everyday data collection and analysis, such as sports scores, surveys, or experiment results. It forms the bridge between raw data and visual representation (bar or pie charts).
Conceptual vs Procedural Balance
Conceptual: Understanding why data is grouped by value in a frequency table.
Procedural: Counting occurrences accurately to complete the table.
The combination ensures both comprehension and fluency in data organisation.
Learning Objectives Addressed
- Read and interpret lists of raw data.
- Count and record frequencies for specific values.
- Complete and verify frequency tables accurately.
- Understand the link between data collection and data representation.
What Your Score Says About You
- Below 15: Revisit counting and categorising values — practise with shorter data lists.
- 16–22: Good progress — focus on double-checking your frequency counts.
- 23–29: Strong understanding — ready to summarise larger datasets or connect results to charts.
- 30 / 30: Excellent! You can now construct and interpret full frequency tables in Survey 4A or Bar Chart 4, linking raw data to graphical representations.