Survey 3E
Overview
In this Phlow, learners investigate different types of data and how data can be gathered effectively. They explore two key contexts:
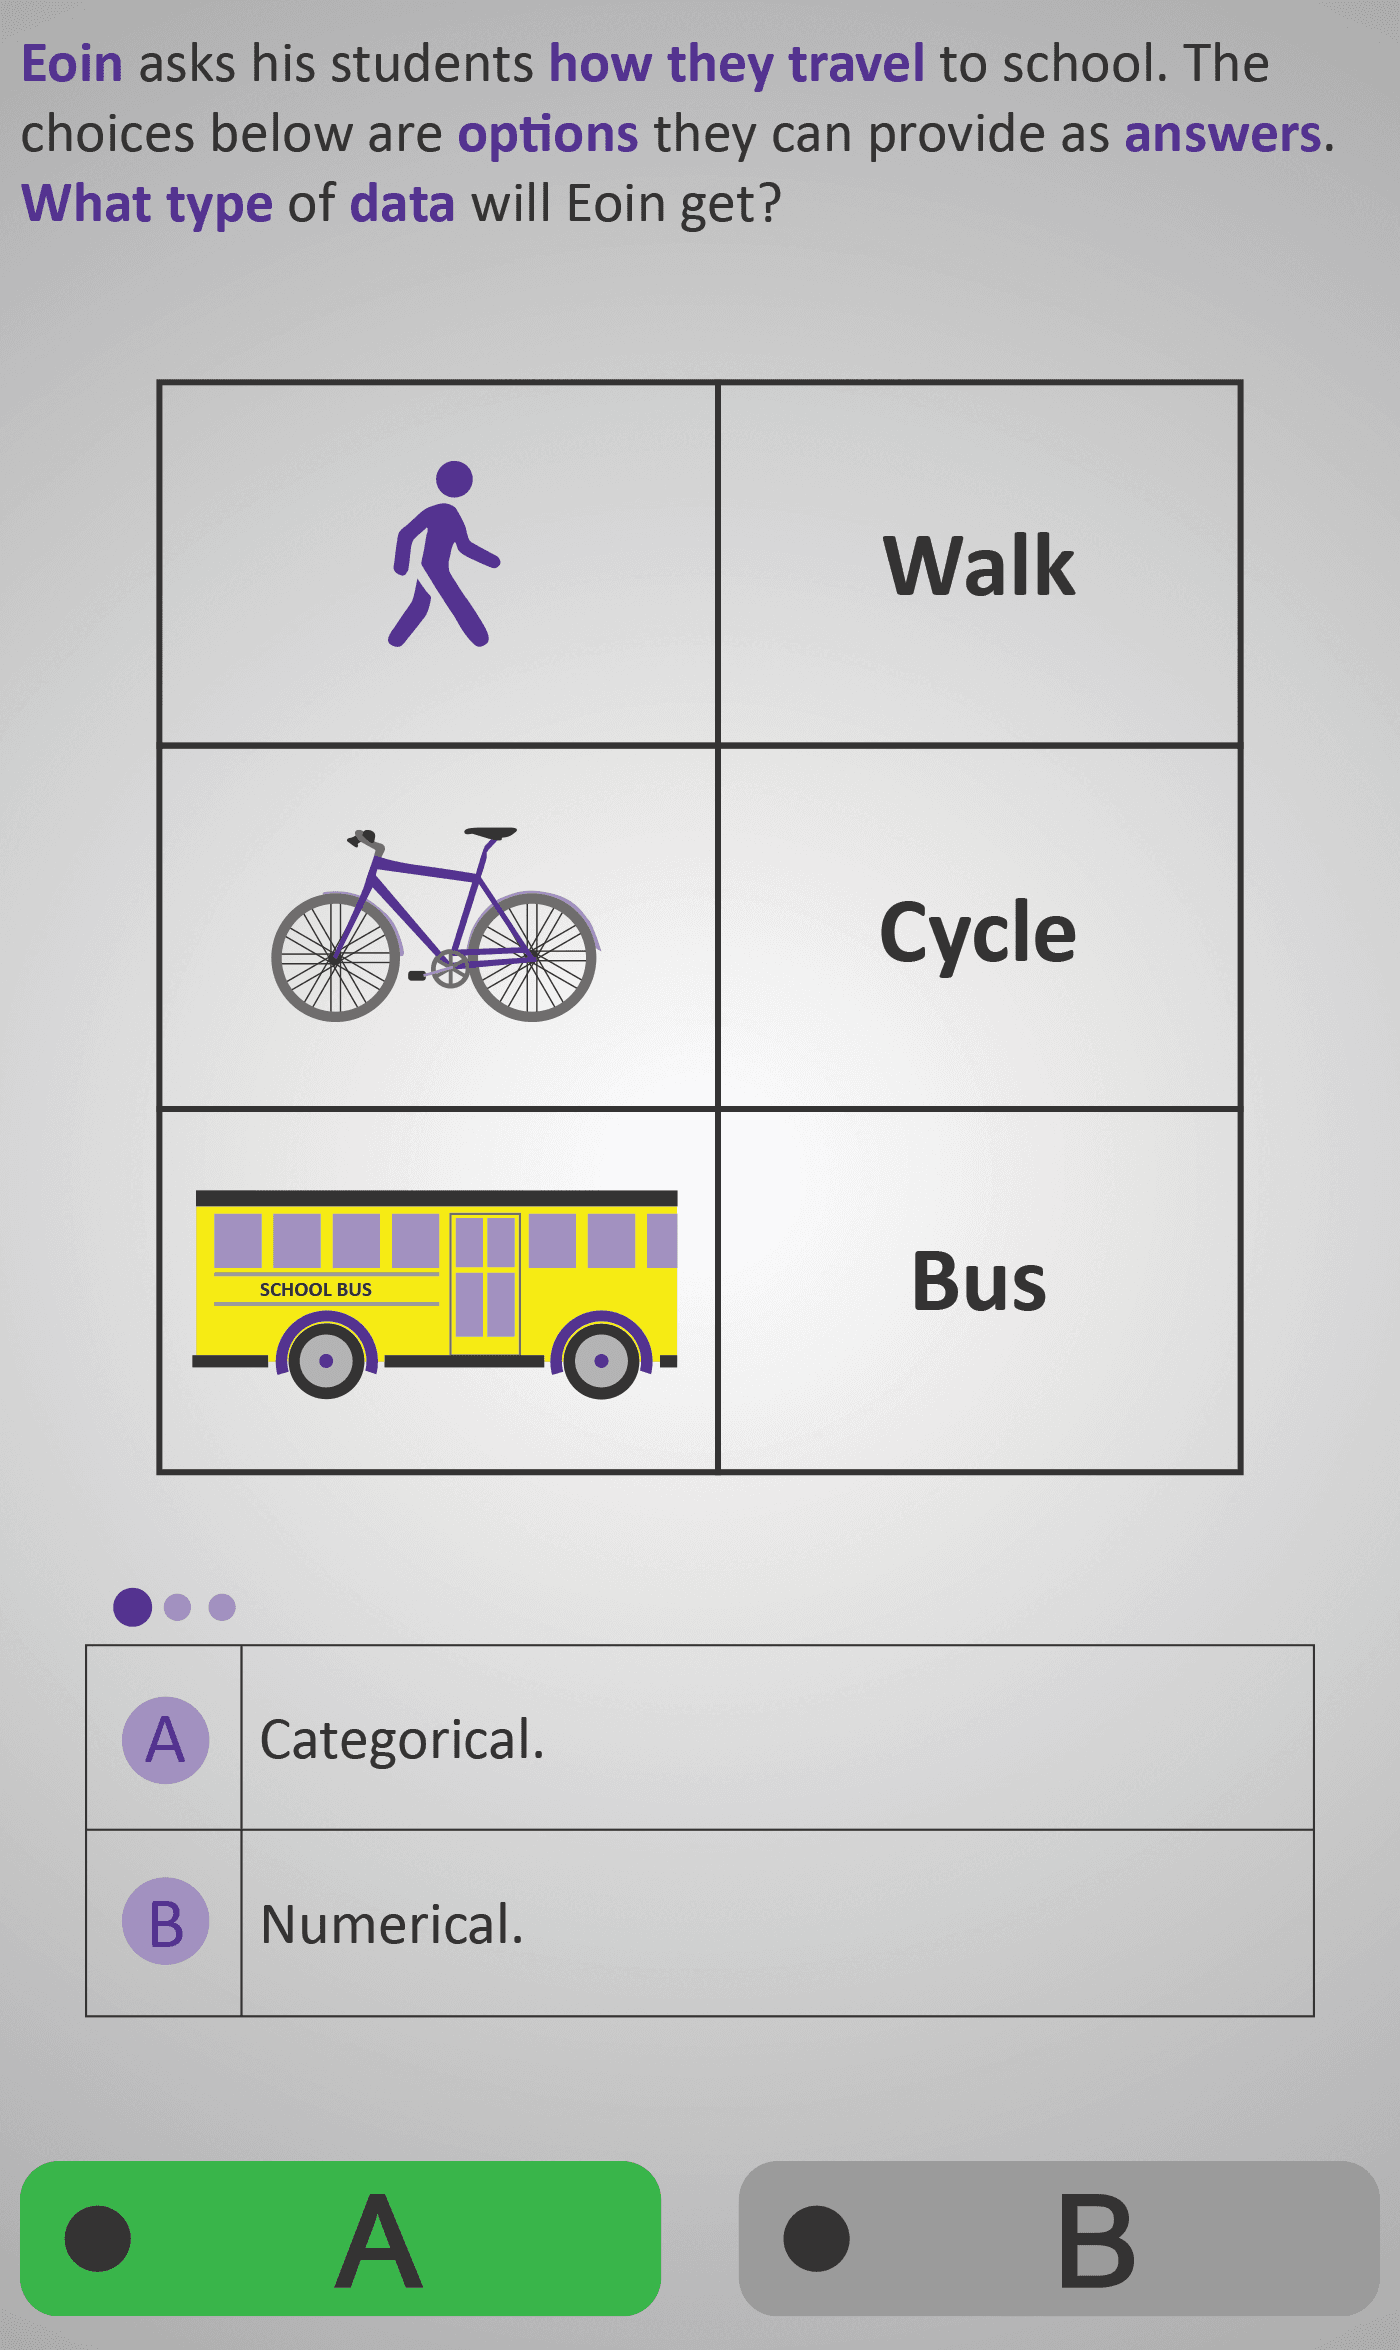
- Eoin’s survey about how students travel to school (walk, cycle, bus).
- John’s coin toss experiment, where outcomes of heads and tails are recorded.
Through these scenarios, students discover the difference between categorical data (answers that describe groups or types, like “Walk” or “Bus”) and numerical data (answers that are counts or quantities, such as “number of heads”).
They also think critically about how survey questions can be improved — for instance, by adding an “Other” option to ensure everyone’s responses are represented fairly. By the end, learners can clearly distinguish between question types, data types, and fair representation in surveys.
This Phlow strengthens understanding of how data collection design affects the quality and usefulness of results. It encourages learners to think like young data scientists: not just collecting numbers, but ensuring those numbers are meaningful and complete.
Prerequisite Knowledge Required
- Awareness that data can describe characteristics (words) or quantities (numbers).
- Familiarity with simple surveys from previous Phlows (e.g., Survey 3A–3D).
- Ability to read and interpret basic bar charts and tables.
- Understanding that fair questions include suitable options for all respondents.
Main Category
Statistics / Data Handling – Data Types and Question Design
Estimated Completion Time
Approx 10–12 seconds per question (30 total). Total time: 5–6 minutes.
Cognitive Load / Step Size
Moderate — the task transitions from recognising examples to reasoning about why data fits a type and how question design affects inclusivity. Visuals (icons, coins, charts) help reduce abstraction and support comprehension.
Language & Literacy Demand
Moderate — introduces key vocabulary such as categorical, numerical, option, and question. Each term appears in context with visual support, making them accessible to learners encountering these ideas for the first time.
Clarity & Design
- Vibrant visuals (walking figure, bus, bicycle, coin) provide intuitive context.
- Multiple-choice structure keeps interaction simple and engaging.
- Sequential flow: identify → explain → improve question.
- Purple highlights link key words like “data” and “question” across screens.
Curriculum Alignment
Strand: Statistics
Strand Unit: Representing and Interpreting Data
- Differentiate between categorical and numerical data.
- Recognise how question wording affects data collection.
- Appreciate the importance of fair and inclusive survey design.
- (Aligned with Junior Cycle Mathematics Learning Outcomes 2.18, 2.19, 2.20.)
Engagement & Motivation
High — relatable real-world contexts such as school travel and coin tossing keep learning engaging and authentic. Visuals and short reasoning steps promote curiosity and confidence.
Error Opportunities & Misconceptions
- Confusing “numerical” with numbers that simply appear in the question text.
- Believing categorical data must always involve text responses.
- Overgeneralising small samples (e.g., assuming 10 flips represent all outcomes).
These misconceptions are corrected through side-by-side examples, guided reasoning, and “improve the question” tasks.
Transferability / Real-World Anchoring
Excellent — this Phlow reflects real practices in surveys, questionnaires, and experiments. It builds skills essential for understanding fairness, accuracy, and bias in data collection — useful in both everyday life and STEM studies.
Conceptual vs Procedural Balance
Conceptual: Understanding what makes data categorical or numerical and
why question wording matters.
Procedural: Identifying and classifying examples by type.
The blend builds both critical thinking and applied understanding of data quality.
Learning Objectives Addressed
- Distinguish between categorical and numerical data.
- Evaluate and improve survey questions for fairness and inclusivity.
- Recognise how question wording shapes data collection.
- Understand the importance of representative sampling.
What Your Score Says About You
- Below 15: Review what categorical and numerical data mean — practise classifying examples.
- 16–22: You can identify data types — next, focus on designing better questions.
- 23–29: Strong understanding — you can classify and justify data types accurately.
- 30 / 30: Excellent! You’re ready for Survey 4A – Analysing Real-Life Data Sets and Probability 4B – Likelihood and Fairness.