Survey 3G
Overview
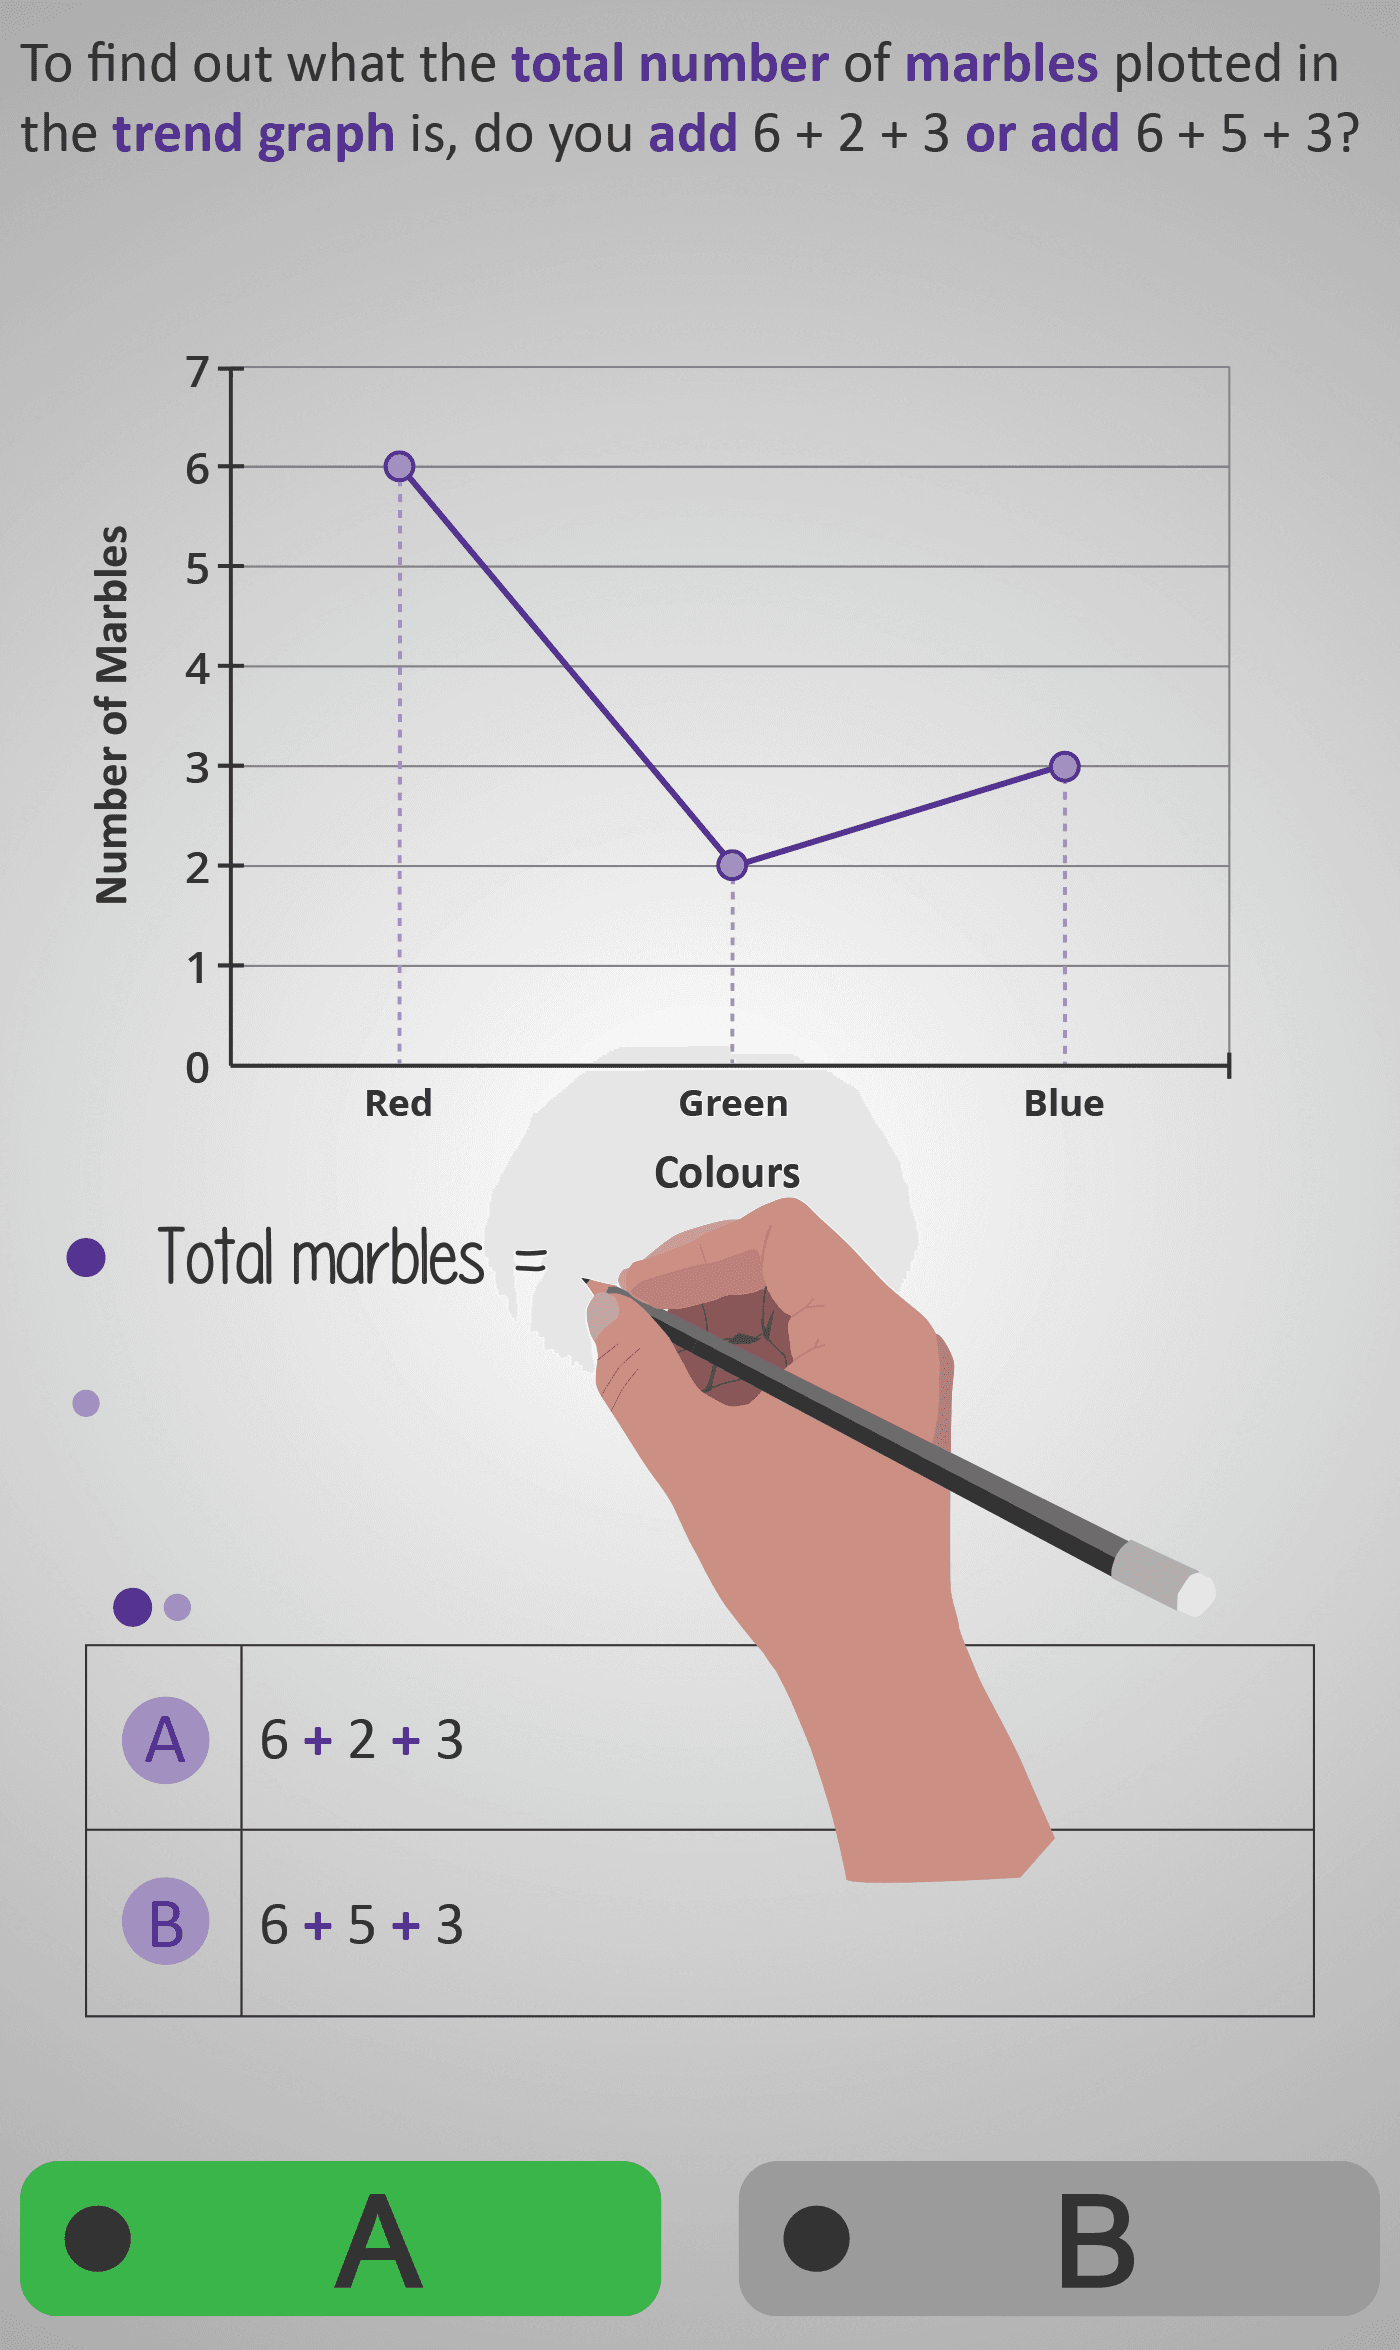
In this Phlow, learners take the next step in data interpretation by moving from reading individual points on a trend graph to calculating total amounts represented on the graph.
Across familiar, real-world examples — counting marbles, pizzas sold, and the number of edges on shapes — students identify each plotted value and practise adding them together to find the total. They choose between different addition options before confirming the correct total.
Each question reinforces a key concept: Every plotted point on a graph represents a value that can be combined with others to find an overall total.
Through gradual progression from simple to slightly more complex datasets, learners strengthen their ability to connect visual information with arithmetic reasoning. The animated “handwriting” cue (e.g., 6 + 2 + 3) models the thought process step-by-step, encouraging learners to double-check their reasoning before selecting an answer.
This Phlow builds a bridge between graph reading and numerical reasoning, preparing learners for future concepts like averages, comparisons, and cumulative totals.
Prerequisite Knowledge Required
- Ability to read numerical values accurately from trend graphs (Survey 3F).
- Understanding of basic addition and combining multiple quantities.
- Awareness that each plotted point represents one discrete data value.
- Familiarity with labelled axes — x-axis for categories, y-axis for quantities.
Main Category
Statistics / Data Handling – Trend Graph Interpretation
Estimated Completion Time
Approx 10–14 seconds per question (30 total). Total time: 5–7 minutes.
Cognitive Load / Step Size
Moderate — learners engage both visual and numerical reasoning. The consistent structure (graph → addition → total) provides strong scaffolding, enabling focus on understanding relationships between data points.
Language & Literacy Demand
Low to Moderate — key mathematical terms such as total, sum, and add are repeated with visual reinforcement. Short question phrasing and symbolic notation minimise reading demand and support comprehension.
Clarity & Design
- Animated handwriting shows how numbers are combined step-by-step.
- Graph scales and labels are consistent, avoiding confusion.
- Colour-coded values and operations maintain focus on the current question.
- Gradual increase in dataset complexity builds fluency and confidence.
Curriculum Alignment
Strand: Statistics
Strand Unit: Representing and Interpreting Data
- Extract and interpret numerical values from graphs.
- Calculate totals and sums from plotted data.
- Combine graphical and numerical information to draw conclusions.
- (Aligned with Junior Cycle Mathematics Learning Outcomes 2.18, 2.19, 2.20.)
Engagement & Motivation
High — the everyday contexts (marbles, pizzas, shapes) are playful and relatable. The interactive, sequential addition builds confidence and flow, while immediate feedback reinforces correct reasoning.
Error Opportunities & Misconceptions
- Omitting one or more plotted points from the total.
- Misreading a plotted value (e.g., mistaking 6 for 7).
- Assuming totals can be estimated visually without exact reading.
These are addressed through visual cues, clear scaling, and explicit modelling of the correct calculation process.
Transferability / Real-World Anchoring
Strong — learners develop transferable skills for interpreting totals in real contexts, from sales data to survey results and sports statistics. Understanding how to derive totals visually supports broader numeracy across school and daily life.
Conceptual vs Procedural Balance
Conceptual: Recognising that each plotted value represents a quantity to be combined.
Procedural: Performing accurate addition using extracted values.
The combination builds both visual understanding and arithmetic fluency.
Learning Objectives Addressed
- Read and extract numerical data from trend graphs.
- Add and combine multiple values to calculate totals.
- Connect graphical representations to arithmetic operations.
- Build readiness for averages and cumulative totals.
What Your Score Says About You
- Below 15: Practise reading precise values from graphs and checking your sums carefully.
- 16–22: Good progress — you can identify values and add with accuracy.
- 23–29: Excellent reasoning — you understand totals and data patterns.
- 30 / 30: Outstanding! You’re ready for Survey 4A – Analysing Multi-Step Graph Problems and Survey 4B – Averages and Ranges from Graphs.