Venn Diagram 3B
Overview
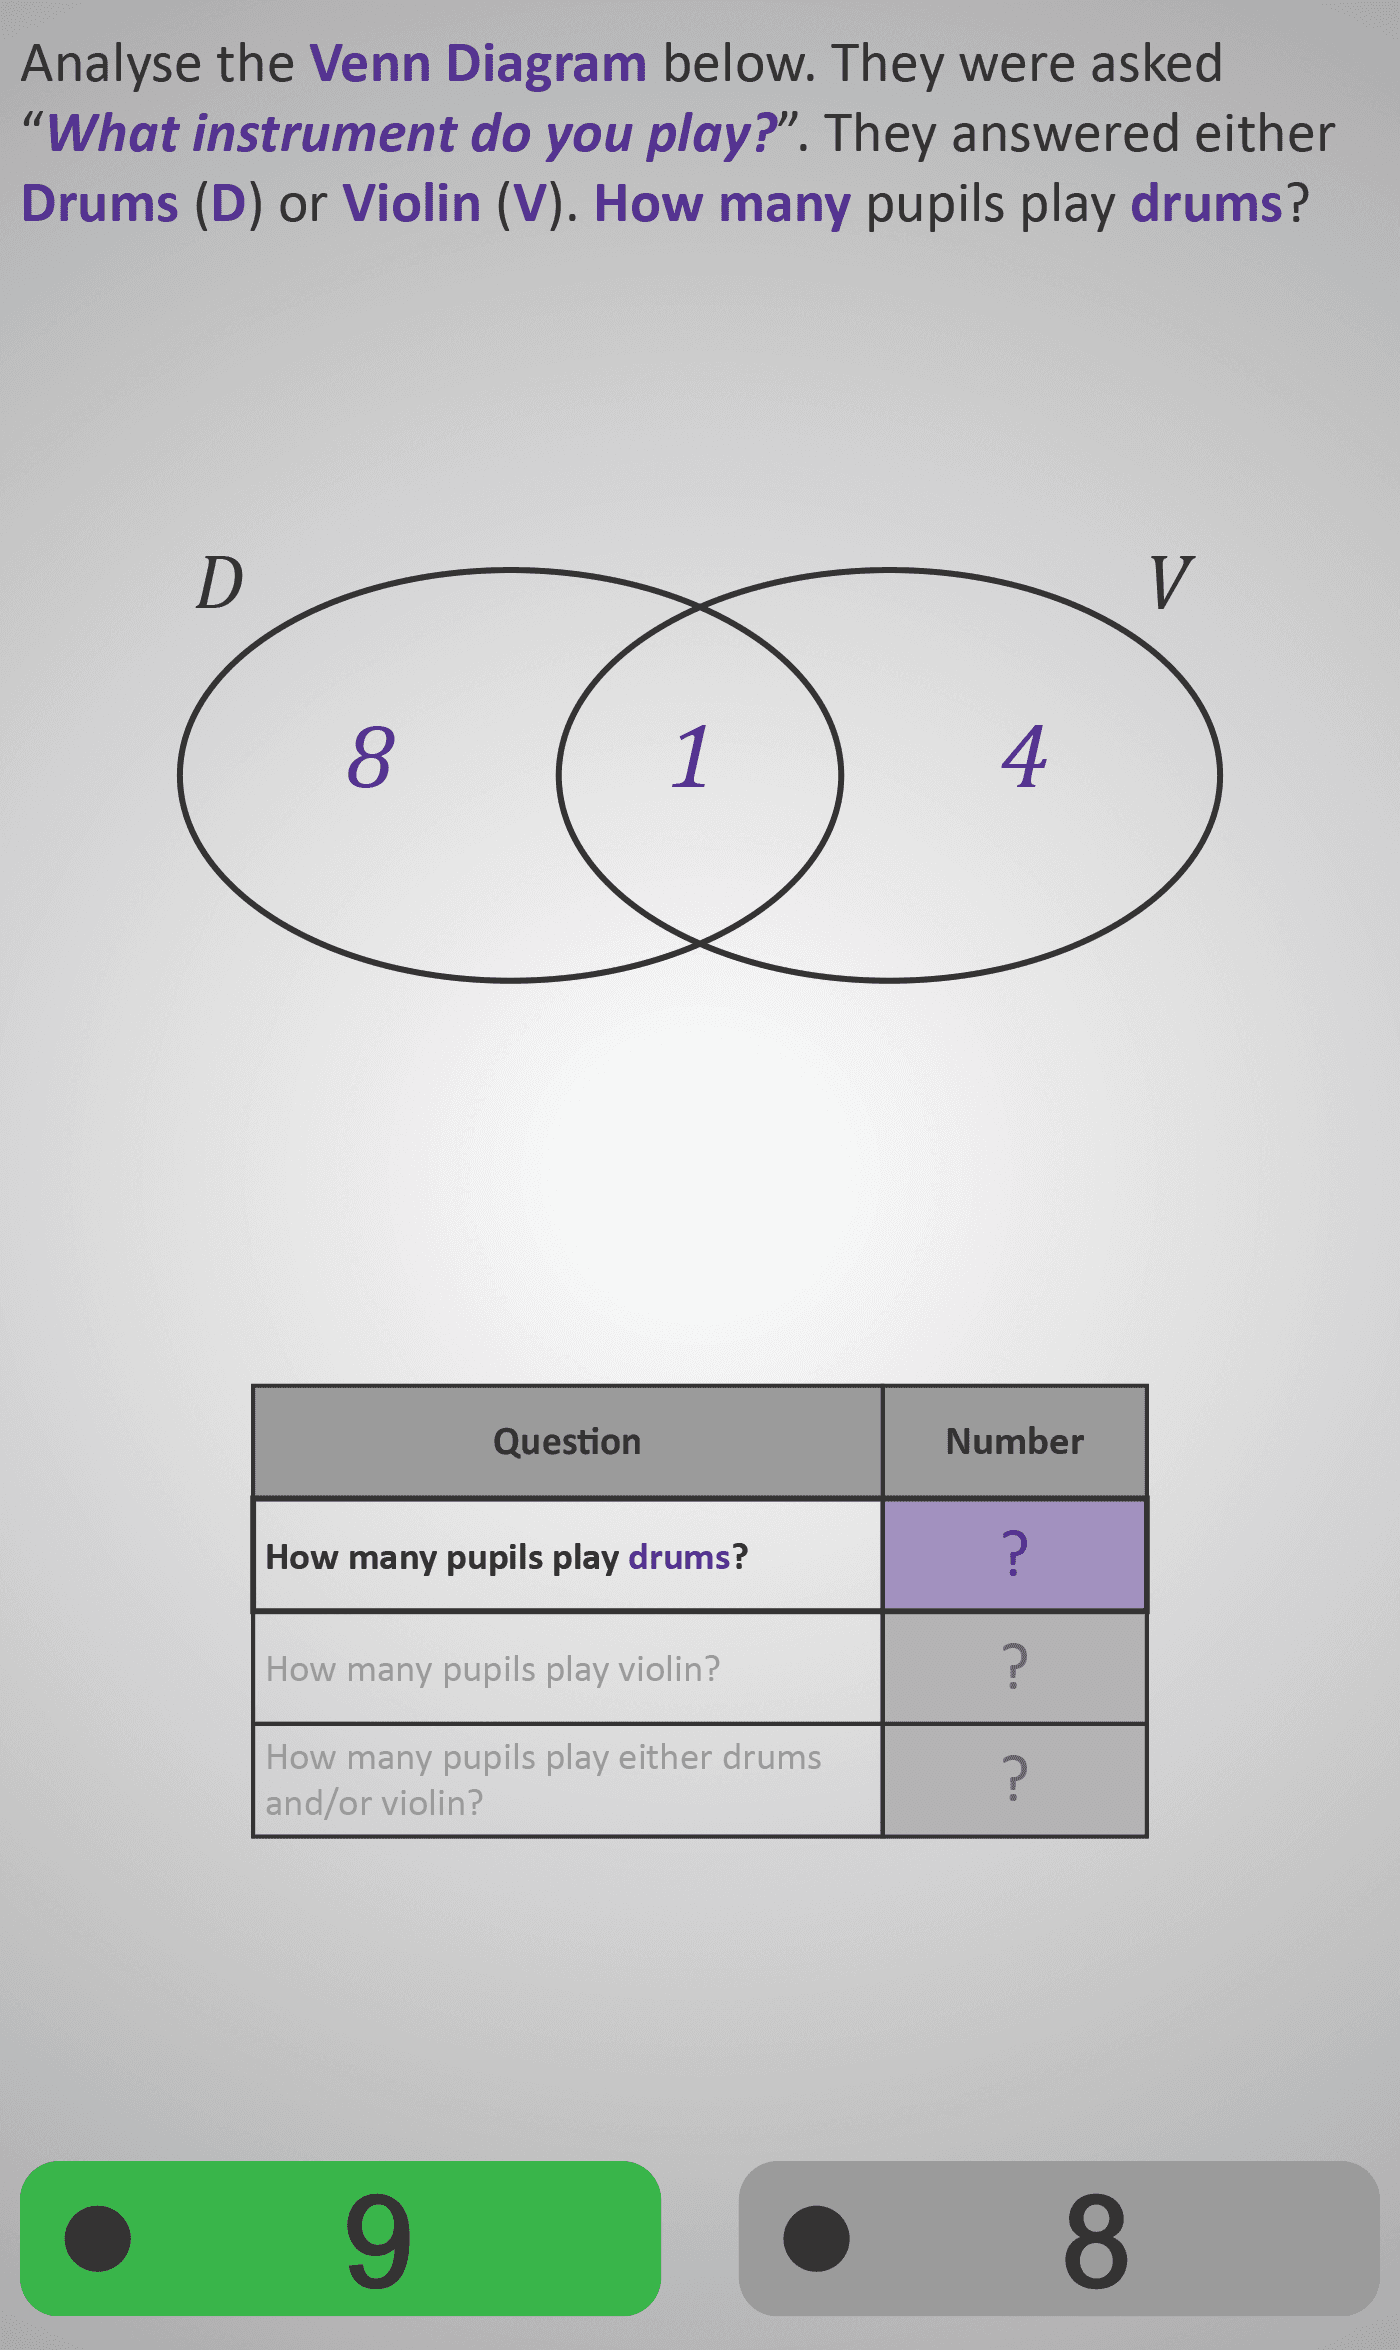
In this Phlow, learners deepen their understanding of Venn Diagrams by interpreting numerical data that shows overlapping categories. Using a relatable real-world context — pupils playing Drums (D) and Violin (V) — students explore how the overlap between circles represents pupils who play both instruments.
Learners begin by identifying totals within individual sets (e.g., those who play only Drums or only Violin) before progressing to find the intersection (students who play both) and the union (those who play either or both). This structured approach strengthens understanding of how overlapping sets combine logically.
Through step-by-step problem solving, learners build confidence in adding and subtracting data correctly while avoiding common mistakes like double-counting. By the end, students can accurately interpret and calculate values from Venn Diagrams representing real survey data.
- Identify and calculate totals within and across sets.
- Distinguish between intersection (and) and union (or) reasoning.
- Apply set-based logic to real-world data problems.
- Understand how Venn Diagrams represent overlapping categories.
Prerequisite Knowledge Required
- Ability to read and interpret basic Venn Diagrams (from Venn Diagram 3A).
- Understanding that overlapping regions represent shared membership.
- Familiarity with simple addition and subtraction in data contexts.
- Awareness that totals must include shared elements only once.
- Linked earlier Phlows: Venn Diagram 3A – Identifying Elements in Sets; Survey 2A – Representing Data in Tables; Add/Sub 2B – Combining and Comparing Quantities.
Main Category
Data and Probability → Sets and Relationships
Estimated Completion Time
Approx 8–12 seconds per question (30 total). Total time: 4–6 minutes.
Learning Outcomes
- Read and interpret Venn Diagrams showing overlapping categories.
- Identify and calculate totals within single sets and intersections.
- Understand and apply the concept of union (and/or) in set reasoning.
- Use logical reasoning to connect visual data with numerical relationships.
Cognitive Load / Step Size
Moderate — learners progress from simple single-set counting to calculating totals that include overlap and union. The consistent context (musical instruments) anchors the logic, reducing abstraction while maintaining engagement.
Language & Literacy Demand
Medium — introduces key comparative terms like either, and/or, and overlap. These are supported visually through coloured set labels (D and V) and consistent phrasing. The combination of visual and linguistic reinforcement strengthens comprehension.
Clarity & Design
- Simple, symmetric Venn Diagrams with balanced spacing between sets.
- Minimal numbers per region to keep focus on logic rather than arithmetic.
- Coloured labels (D, V) and clear union/intersection symbols aid retention.
- Tables beneath diagrams link visual reasoning with survey data numerically.
Curriculum Alignment
Strand: Data and Probability → Representing and Interpreting Data
Learning Outcome: Represent, interpret, and analyse data using diagrams and logical reasoning, recognising overlap and union between sets.
(Aligned with Junior Cycle Mathematics – Strand 4: Data and Probability, Learning Outcomes 4.7 & 4.8.)
Engagement & Motivation
The musical instrument context makes the topic accessible and interesting. The problem-solving format — identifying, combining, and reasoning about totals — gives a real sense of discovery and application, promoting engagement through relatable data.
Error Opportunities & Misconceptions
- Forgetting to include the intersection when finding the union total.
- Double-counting students in both categories.
- Confusing the meaning of and (intersection) with or (union).
Visual cues and repeated structure across examples prevent these errors, helping students build accuracy through pattern recognition.
Transferability / Real-World Anchoring
Highly transferable — applicable to interpreting surveys, statistics, and research data. The logical structure of set reasoning underpins later work in probability, computer science, and database queries (AND/OR conditions).
Conceptual vs Procedural Balance
Conceptual: Understanding what overlap and union represent in real contexts.
Procedural: Applying addition and subtraction rules accurately when combining data.
The Phlow balances both to develop logical reasoning alongside procedural fluency.
What Your Score Says About You
- Below 15: Needs practice identifying overlap and calculating correct totals.
- 16–22: Understands sets but may occasionally miscount intersections.
- 23–29: Strong comprehension of set logic and accurate with totals.
- 30 / 30: Mastery — interprets and calculates complex Venn relationships confidently and consistently.