Venn Diagram 3E
Overview
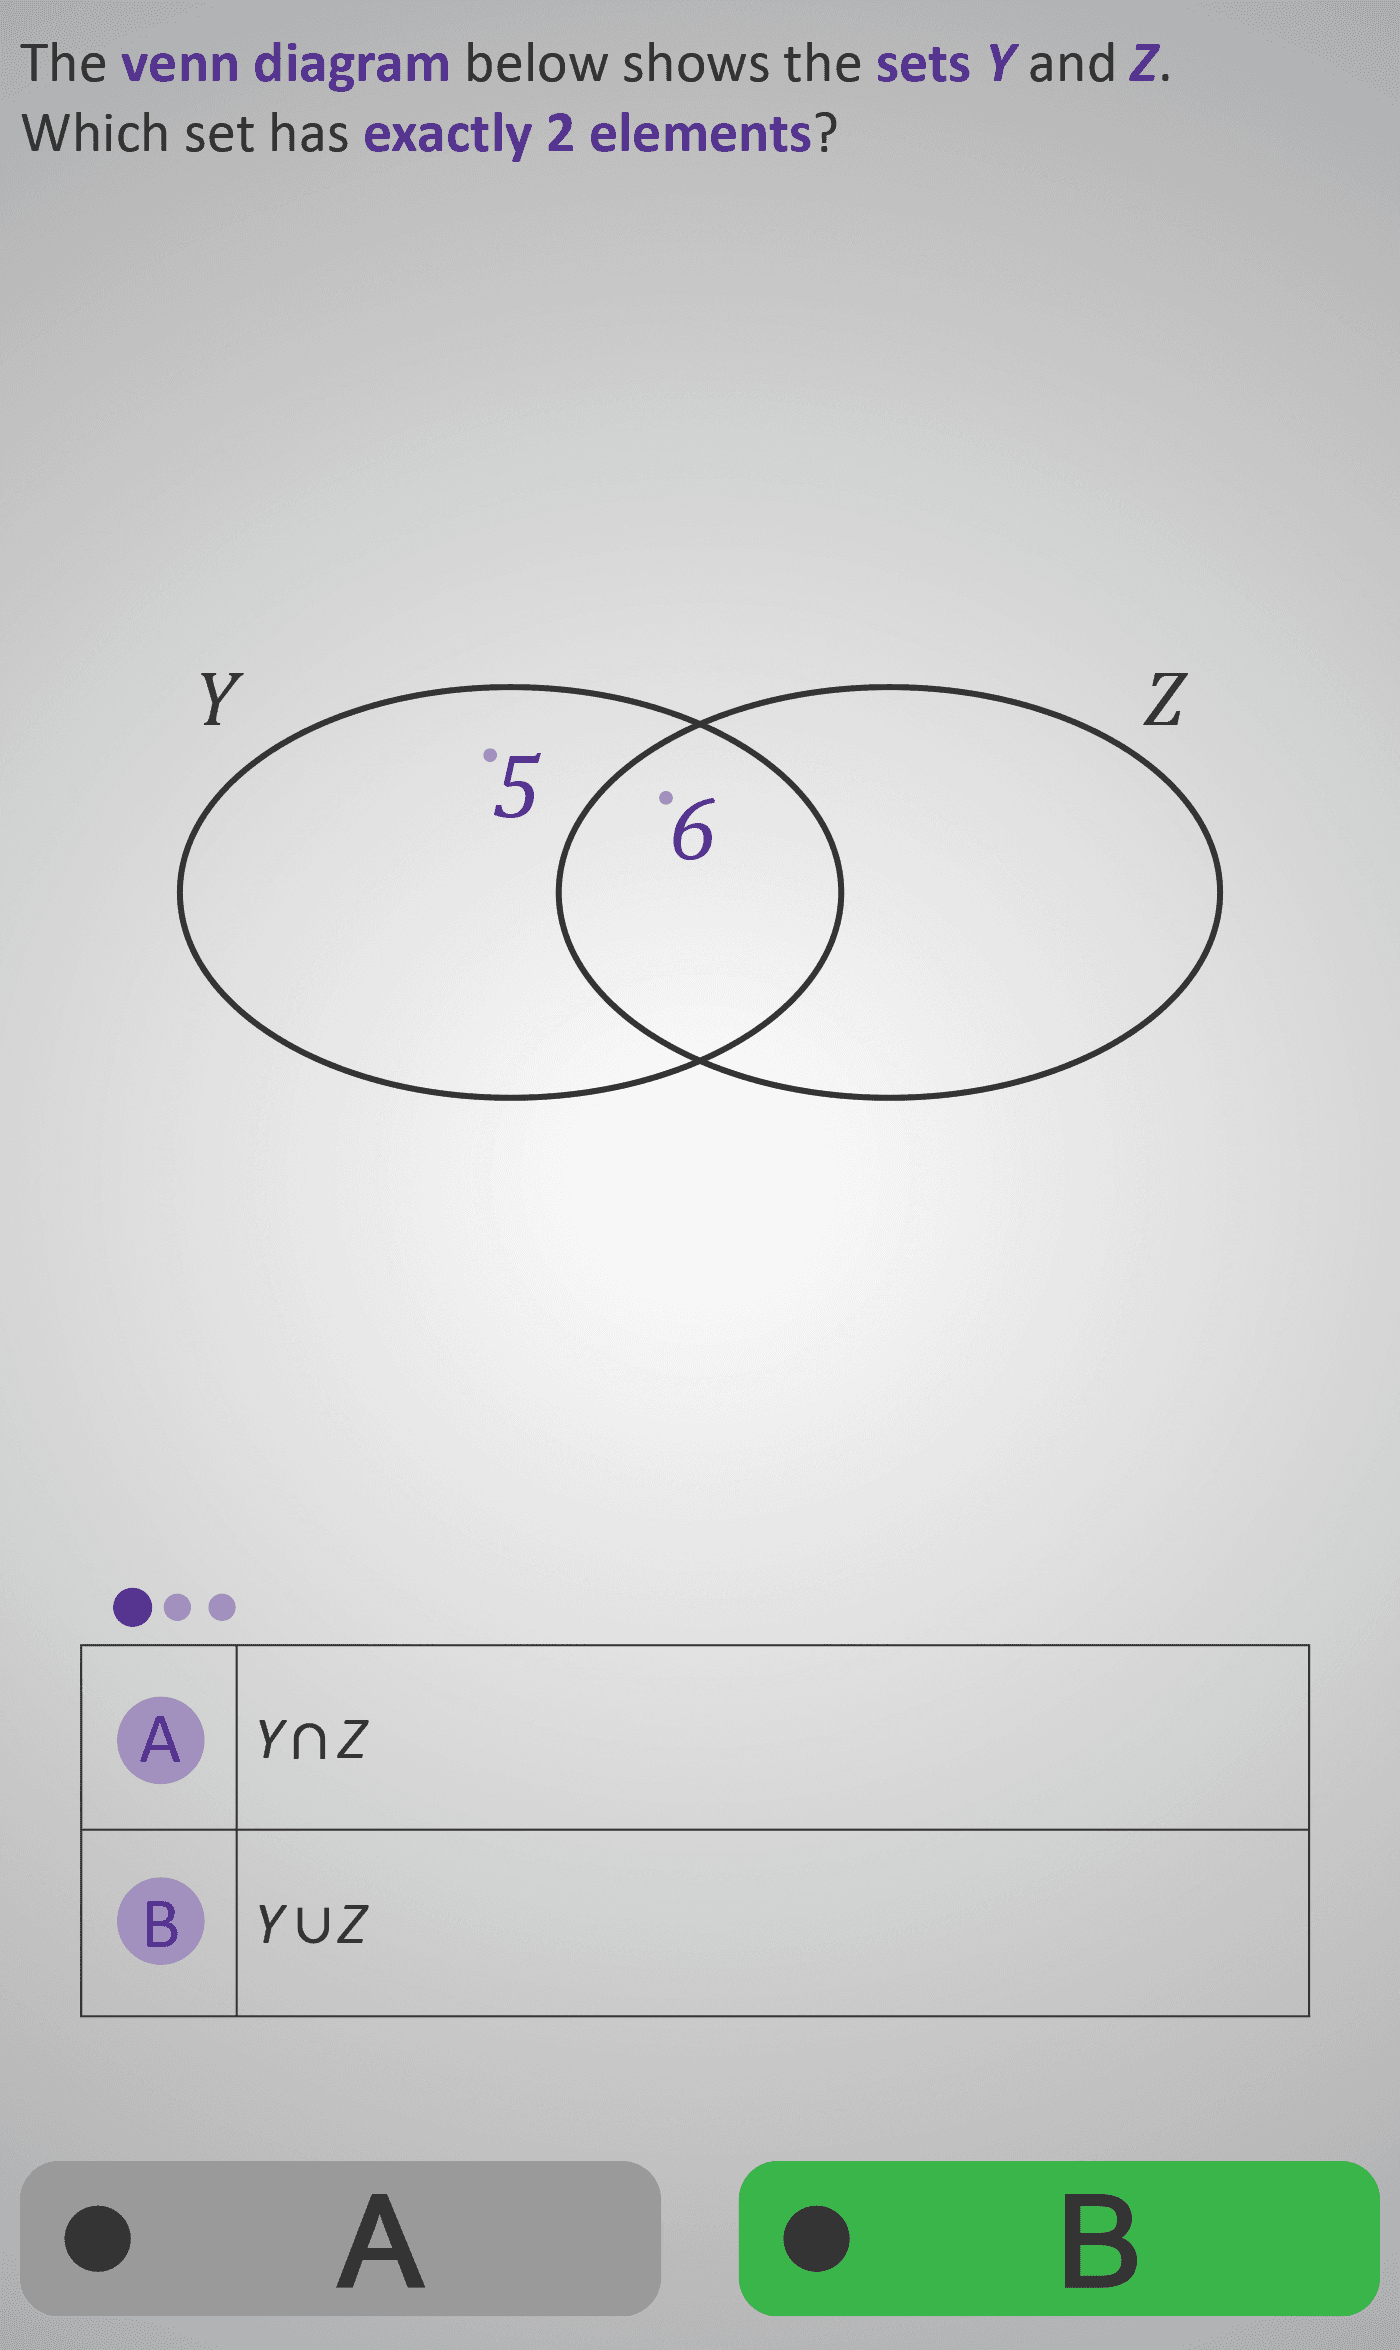
In this Phlow, learners extend their understanding of Venn Diagrams by counting how many elements belong to different regions within overlapping sets. Two sets, Y and Z, are shown with shared and separate regions. Students are asked to identify which set — or combination of sets — contains a specific number of elements.
By distinguishing between intersection (Y ∩ Z) — the shared region — and union (Y ∪ Z) — the total of all elements in both sets — learners practise reasoning about inclusion, overlap, and numerical totals. Through these structured comparisons, they develop confidence reading diagrams, interpreting notation, and linking visual representations to symbolic meaning.
This Phlow marks the transition from recognising set relationships to quantifying them. Learners develop logical precision and numerical fluency in preparation for future probability and data reasoning tasks.
- Identify and count elements belonging to individual sets, intersections, and unions.
- Use mathematical symbols ∩ (intersection) and ∪ (union) accurately.
- Translate visual information from Venn Diagrams into numeric and symbolic form.
- Reason logically about overlapping relationships between sets.
Prerequisite Knowledge Required
- Ability to interpret simple overlapping Venn Diagrams.
- Understanding of “shared” and “only” elements.
- Familiarity with basic set notation from earlier Phlows (Venn Diagram 3A–3D).
- Comfort with basic counting and comparing quantities.
- Linked earlier Phlows: Venn Diagram 3B – Overlaps Between Sets; Venn Diagram 3C – Subsets; Venn Diagram 3D – Symbols (∈, ∉).
Main Category
Data and Probability → Sets and Operations
Estimated Completion Time
Approx 8–12 seconds per question (30 total). Total time: 4–6 minutes.
Learning Outcomes
- Identify and count how many elements belong to each region in a Venn Diagram.
- Understand and apply the meaning of ∩ and ∪ in symbolic form.
- Compare and quantify overlap versus combined totals between sets.
- Express visual relationships numerically and logically.
Cognitive Load / Step Size
Moderate — learners move from qualitative recognition to quantitative reasoning. Each step isolates one aspect of the diagram (set Y, set Z, Y ∩ Z, or Y ∪ Z), supporting gradual understanding through repetition and contrast.
Language & Literacy Demand
Medium — introduces formal mathematical symbols (∩, ∪) and comparative language like “exactly one” and “exactly two.” Visual alignment of notation beside each Venn region aids comprehension and symbol retention.
Clarity & Design
- Simple, two-circle diagrams with balanced spacing and minimal numbers.
- Consistent use of purple to highlight active regions (intersection or union).
- Each question isolates a single reasoning step — “Which contains exactly 1 element?” etc.
- Visual pairing of symbols and diagrams reinforces abstract notation through concrete examples.
Curriculum Alignment
Strand: Data and Probability → Sets and Logic
Learning Outcome: Describe and represent relationships between sets using intersection (∩), union (∪), and numerical reasoning.
(Aligned with Junior Cycle Mathematics – Strand 1: Number and Relationships, Learning Outcomes 1.15 & 1.16.)
Engagement & Motivation
The visual logic and counting task create a puzzle-like experience that motivates learners to test and confirm their understanding. The satisfaction of matching symbols with visual outcomes reinforces confidence and curiosity in abstract reasoning.
Error Opportunities & Misconceptions
- Confusing ∩ (intersection) with ∪ (union).
- Double-counting elements shared by both sets.
- Misinterpreting “exactly” as “at least.”
Repeated visual reinforcement and structured questions clarify these differences and ensure accurate symbol understanding.
Transferability / Real-World Anchoring
Knowledge of intersection and union underpins data classification, probability, coding logic (AND / OR), and survey analysis. Students learn how overlapping groups interact — a foundational skill for reasoning across disciplines.
Conceptual vs Procedural Balance
Conceptual: Understanding overlap and total inclusion in sets.
Procedural: Counting and applying ∩ and ∪ notation accurately.
The balance ensures learners grasp the meaning before applying operations symbolically.
What Your Score Says About You
- Below 15: Beginning to recognise overlap but may confuse union and intersection.
- 16–22: Understands operations but occasionally misinterprets “exactly.”
- 23–29: Confident applying ∩ and ∪ with precision.
- 30 / 30: Mastery — fluent in describing, counting, and symbolising two-set relationships accurately.