Analyse 4B
Overview
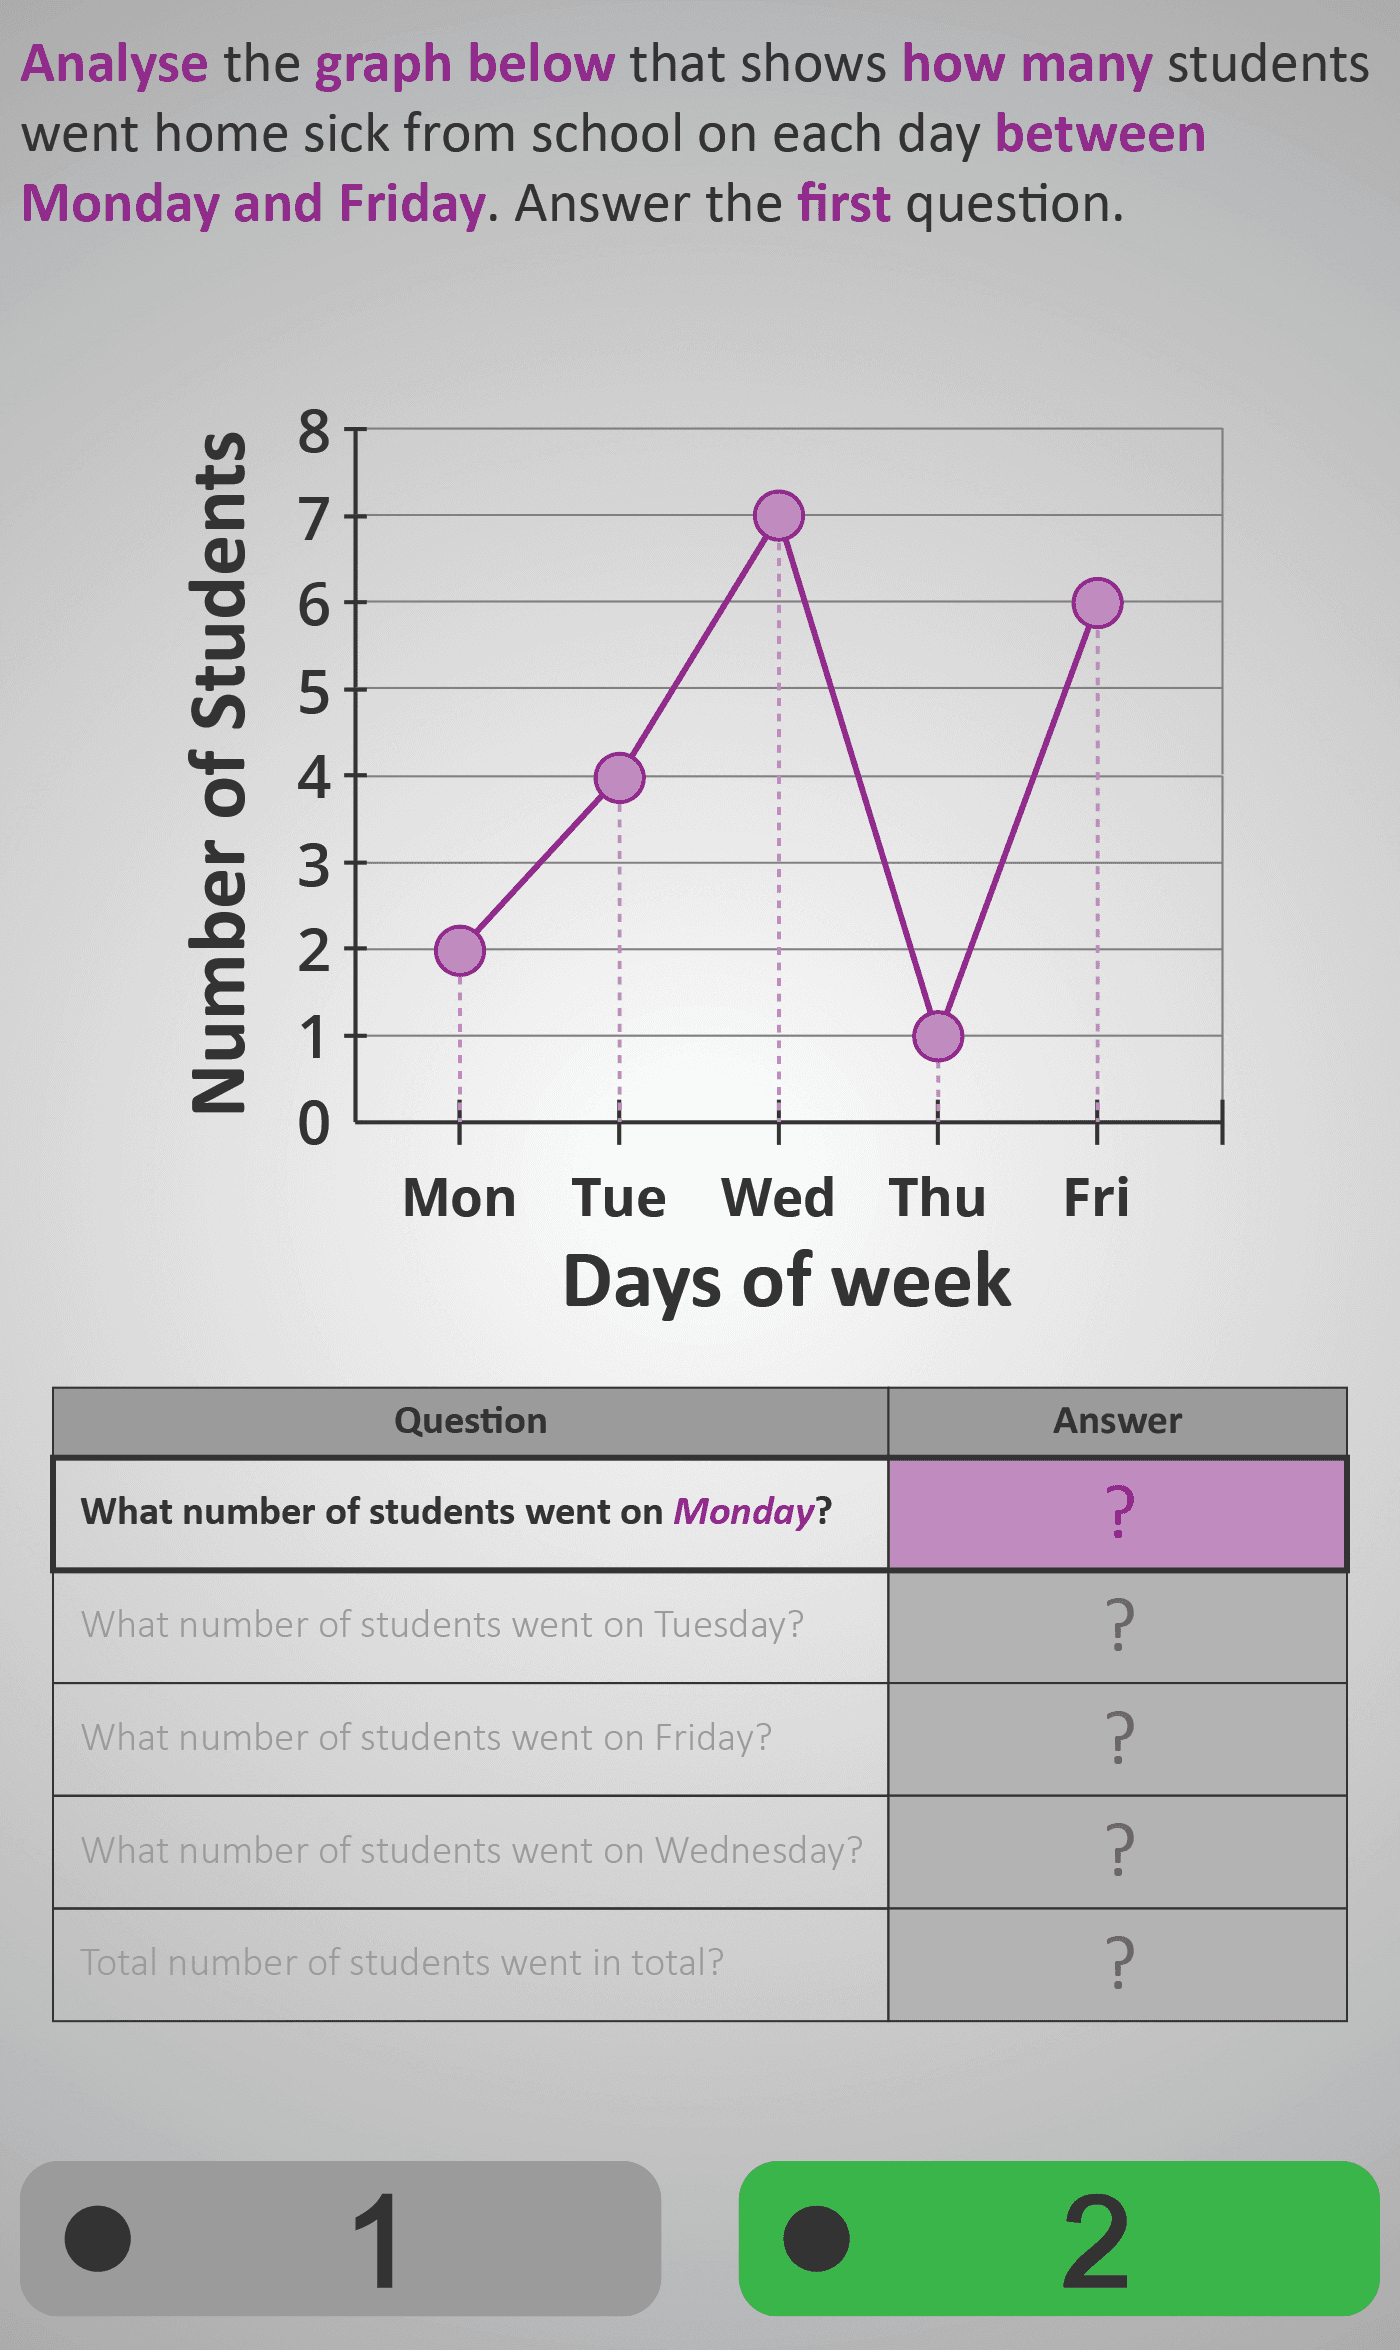
In this Phlow, learners explore how to read and interpret a line graph representing data across five days. The scenario shows how many students went home sick from school between Monday and Friday. Students move through a guided sequence of questions that build from reading to reasoning:
- Identify values for specific days (e.g., “How many students went home on Monday?”).
- Add values to find totals across the week.
- Compare data points (e.g., “Which days had more than 5 students?” or “Monday and what other day had 2 or fewer?”).
The Phlow trains learners to connect numerical information with visual cues — interpreting the vertical axis (quantity) and horizontal axis (categories) while tracing lines between points. Through these structured comparisons, students practise identifying trends, peaks, and totals in everyday data.
By the end, learners gain the ability to move fluidly between reading, comparing, and reasoning — a critical foundation for later work in statistics, data analysis, and scientific interpretation.
- Read numerical values from a line graph accurately.
- Compare and interpret changes between categories.
- Identify minima, maxima, and total quantities.
- Draw conclusions using phrases like “2 or fewer” or “more than 5.”
Prerequisite Knowledge Required
- Understanding of bar charts and pictograms for comparison.
- Familiarity with axes, labels, and reading vertical scales.
- Ability to add and compare small numerical values.
- Awareness that graphs can represent change or comparison over time.
- Linked earlier Phlows: Analyse 3C – Reading Simple Bar Charts; Add & Compare 3B – Comparing Quantities Using Data.
Main Category
Analyse → Data Representation → Line Graphs
Estimated Completion Time
Approx 10–12 minutes (6–7 guided interactions).
Learning Outcomes
- Read and extract data accurately from a line graph.
- Compare quantities across categories and time intervals.
- Identify minimum, maximum, and total values.
- Draw logical conclusions based on given data conditions.
Cognitive Load / Step Size
Moderate — each interaction focuses on one type of reasoning (reading, adding, or comparing) while maintaining a consistent visual format. This supports understanding of graph conventions without overloading working memory.
Language & Literacy Demand
Medium — key comparative language (“more than,” “less than,” “in total”) combines with numeric logic. The Phlow reinforces these terms visually using colour-coded axes and highlighted question text.
Clarity & Design
- Purple line and point highlights create a clear visual focus.
- Consistent axis labelling strengthens orientation.
- Each question isolates a single reasoning skill (read → add → compare).
- Realistic school-based context adds familiarity and engagement.
Curriculum Alignment
Strand: Data and Chance
Learning Outcome: Students read, interpret, and compare data represented in line graphs; extract and combine information to answer questions.
(Aligned with Junior Cycle Mathematics – Strand 2: Statistics and Probability, Learning Outcome 2.6.)
Engagement & Motivation
The real-world context — students going home sick — keeps learning relevant and relatable. The stepwise questioning mimics a teacher’s guidance, helping students feel supported as they decode and understand each part of the graph. Successive correct answers reinforce confidence and curiosity.
Error Opportunities & Misconceptions
- Misreading values between gridlines or at data peaks.
- Confusing horizontal and vertical axes.
- Adding incorrect points when finding totals.
- Misunderstanding conditions like “2 or fewer.”
Immediate visual feedback and highlighted points help learners correct these errors early, reinforcing careful observation and numerical accuracy.
Transferability / Real-World Anchoring
These skills extend directly to reading graphs in science, geography, and social studies — from temperature trends and rainfall to survey analysis. Students gain an appreciation for how visual data supports evidence-based reasoning.
Conceptual vs Procedural Balance
Balanced — students perform the procedural act of reading and adding values while developing conceptual insight into how graphs communicate relationships and change.
What Your Score Says About You
- Below 20: Needs further practice tracing and reading data values accurately.
- 21–30: Can read single points but may mix up totals or comparisons.
- 31–39: Confidently reads and interprets multiple data points with logical reasoning.
- 40 / 40: Mastery — interprets, compares, and analyses line-graph data with clear insight.