Functions 4B
Overview
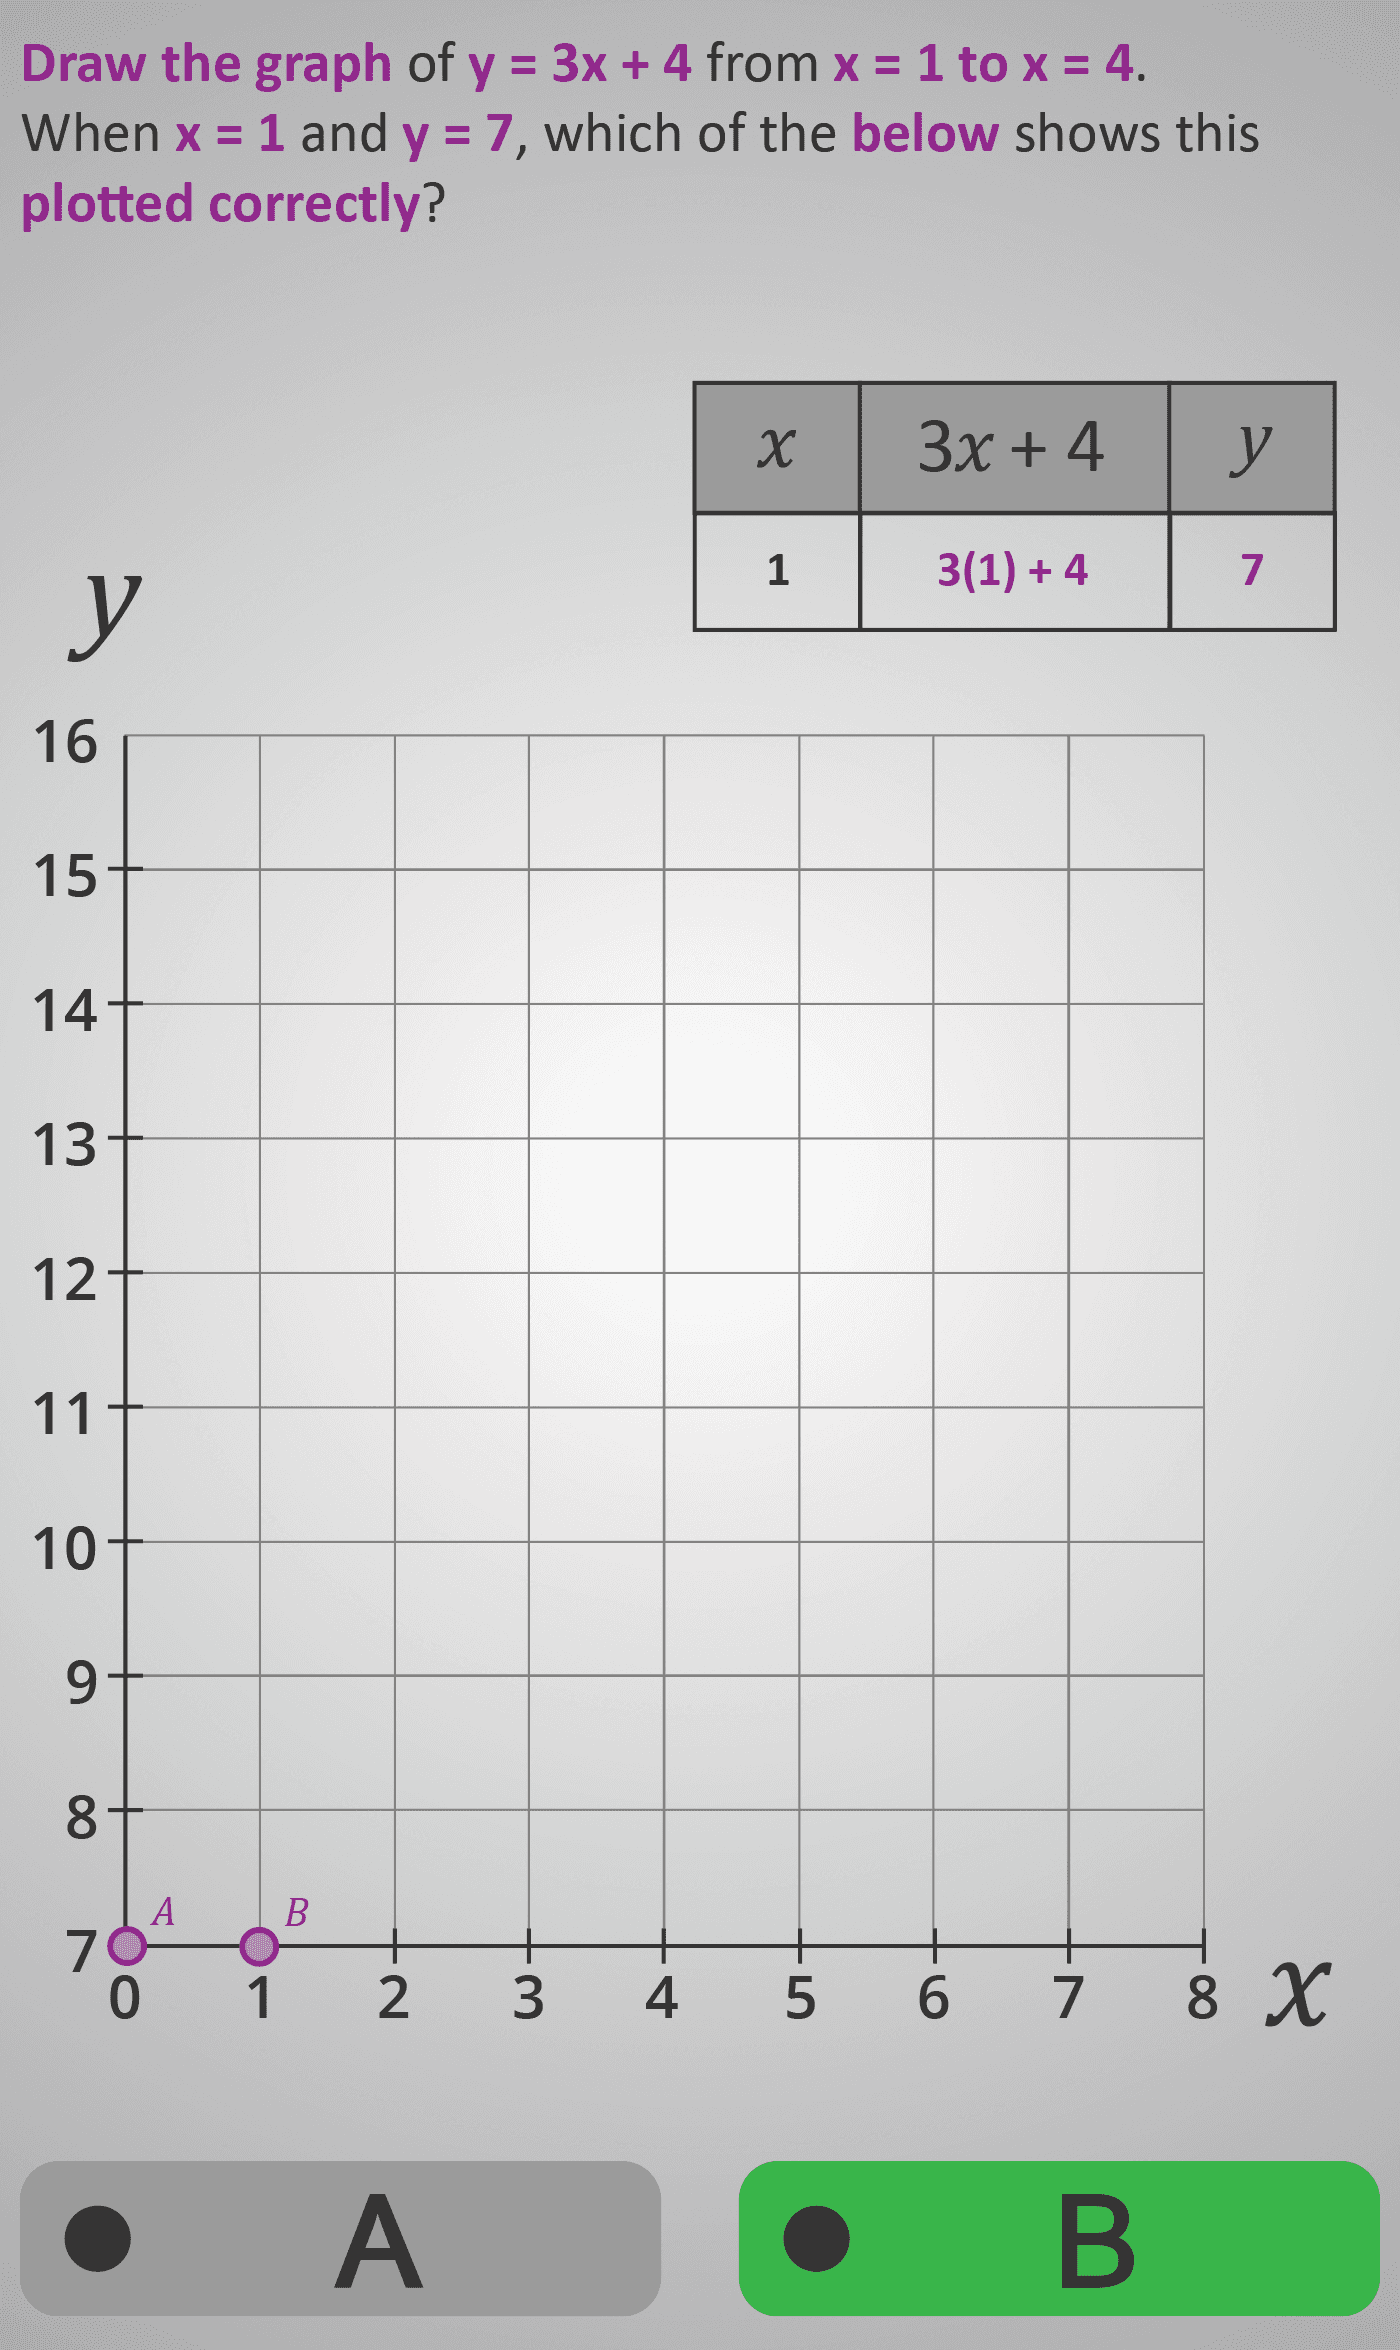
In this Phlow, learners extend their understanding of substitution by representing it graphically. Given the rule y = 3x + 4, students calculate y-values for several x-values (e.g. x = 1 → 4) and plot these points on a coordinate grid.
Each screen focuses on a single coordinate pair — for example, x = 2, y = 10 — and asks which graph shows the point plotted correctly. This structure reinforces that x is the horizontal coordinate and y is the vertical coordinate, preventing the common mix-up between the two.
By completing the activity, students connect symbolic (equation), numerical (table), and visual (graphical) forms of a function, gaining a deeper understanding of how linear functions create straight-line patterns and predictable relationships.
Worked Example
| x | Substitute | y | Plotted Point |
|---|---|---|---|
| 1 | 3(1) + 4 | 7 | (1, 7) |
| 2 | 3(2) + 4 | 10 | (2, 10) |
| 3 | 3(3) + 4 | 13 | (3, 13) |
| 4 | 3(4) + 4 | 16 | (4, 16) |
Learners see that as x increases by 1, y increases by 3 — reinforcing the concept of slope in a simple, intuitive way.
Sample Prompts
- When x = 2, what is y in y = 3x + 4?
- Which graph shows the point (2, 10)?
- What happens to y each time x increases by 1?
- How can you tell the line is straight and not curved?
Why This Matters
Linking formulas, tables, and graphs builds the foundation for understanding rate of change, slope, and intercept — key ideas for higher-level algebra, science, and economics.
Prerequisite Knowledge Required
- Confidence substituting numbers into simple linear equations.
- Understanding of coordinate pairs (x, y) and axis directions.
- Basic arithmetic fluency (multiplication and addition).
- Ability to recognise consistent patterns in change.
Linked Phlows:
Functions 4A – Substituting into y = 4x – 3,
Co-ordinates 3E – Plotting Points,
Patterns 3D – Recognising Constant Differences
Main Category
Algebra → Functions and Graphs
Estimated Completion Time
Approx. 10–14 seconds per question.
40 questions total → Total time: 7–10 minutes.
| Learner Profile | Estimated Time | Description |
|---|---|---|
| One Level Below | 9–10 mins | May confuse x/y placement or misread scales. |
| At Level | 7–8 mins | Substitutes accurately; minor checking needed when plotting. |
| One Level Above | 5–6 mins | Plots fluently, recognises trends instantly. |
Cognitive Load / Step Size
Moderate. Each question focuses on one coordinate pair and one graph choice. The shift from numerical substitution to visual placement adds variety without overwhelming learners.
Language & Literacy Demand
Low. Short, visually guided sentences (e.g. “Which graph shows (2, 10)?”). Key vocabulary is colour-coded and consistently used.
Clarity & Design
- Equation → Table → Graph format reinforces logical progression.
- Clear A/B graph choices keep the focus on reasoning, not drawing.
- Consistent purple highlighting draws attention to substituted numbers and plotted points.
Curriculum Alignment (ROI Junior Cycle Mathematics)
- Strand: Algebra
- Strand Unit: Functions and Graphs
- Learning Outcomes:
- Construct and interpret tables of values for linear functions.
- Plot and identify coordinates on a Cartesian grid.
- Recognise that straight lines represent linear relationships.
- Translate between algebraic, numeric, and graphical representations.
Engagement & Motivation
Moderate to high. The “spot the correct graph” format feels interactive and rewarding, maintaining attention through visual pattern recognition.
Error Opportunities & Misconceptions
- Confusing x- and y-coordinates.
- Plotting points below/above due to scale misreading.
- Errors in substituting into y = 3x + 4.
- Expecting curved patterns instead of linear ones.
Transferability / Real-World Anchoring
High. This skill underpins graph interpretation in science, business, and geography — any situation comparing two changing quantities.
Conceptual vs Procedural Balance
Balanced, leaning conceptual. Learners compute coordinates procedurally but gain conceptual understanding of linearity and proportional change through graphs.
Learning Objectives Addressed
- Substitute values into y = 3x + 4 to find corresponding y-values.
- Plot coordinates correctly on a Cartesian grid.
- Recognise constant change patterns between x and y.
- Identify linear functions visually from graphs.
What Your Score Says About You
- Less than 20: You may be mixing up x and y — review which axis is horizontal.
- 21–29: Understands substitution but may misread the graph scale.
- 31–39: Accurate and consistent plotting — strong visual reasoning.
- 40 / 40: Excellent! You can fluently connect equations, tables, and graphs.