Functions 4C
Overview
In this Phlow, learners interpret linear relationships on a graph using equations of the form y = mx + c. After learning to plot and calculate integer values in earlier Phlows, they now extend this understanding to fractional and decimal x-values such as x = 2.5 or x = 3.5.
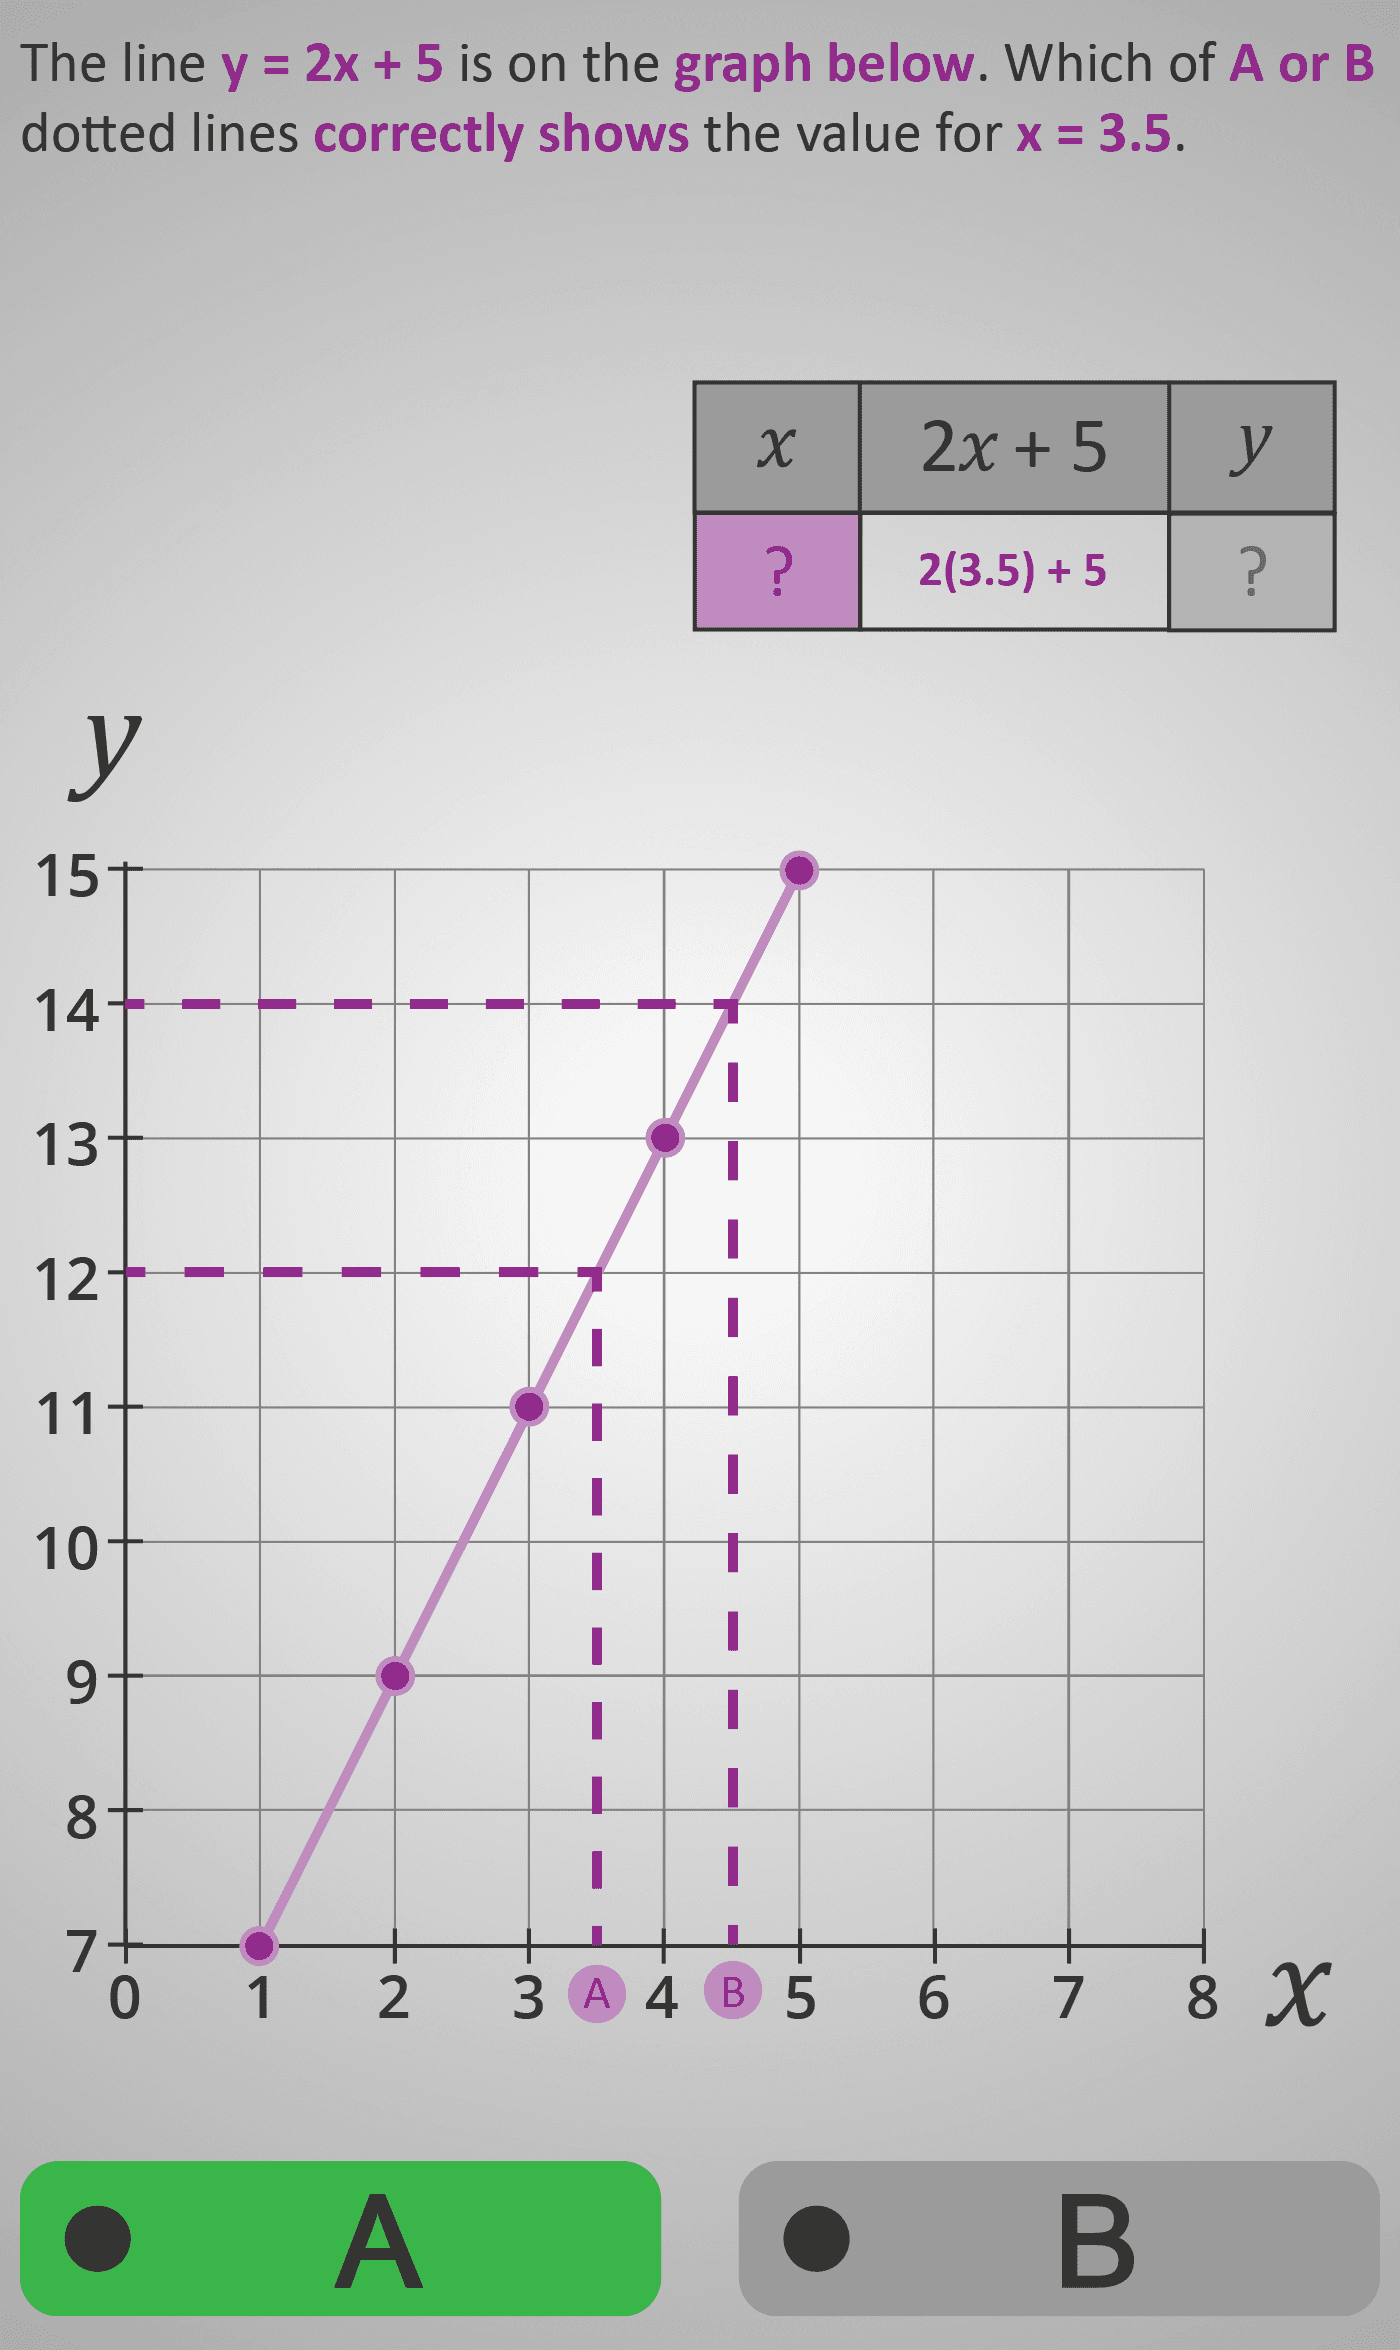
Each question presents a straight-line graph with a table and equation. Students substitute a decimal x into
the equation (e.g., y = 2(3.5) + 5) and verify the result visually by tracing dotted lines from
the axes to the line. This reinforces the consistency between numerical calculation and
graphical interpretation.
By moving fluidly between algebraic, numerical, and spatial reasoning, learners build strong connections between abstract rules and their real-world representations. This prepares them for future topics such as slope, intercepts, and interpreting continuous data.
Worked Example
Given y = 2x + 5:
| x | Substitute | y | Plotted Point |
|---|---|---|---|
| 2 | 2(2) + 5 | 9 | (2, 9) |
| 2.5 | 2(2.5) + 5 | 10 | (2.5, 10) |
| 3 | 2(3) + 5 | 11 | (3, 11) |
| 3.5 | 2(3.5) + 5 | 12 | (3.5, 12) |
Learners notice that as x increases by 0.5, y increases by 1, reinforcing the idea of constant rate of change in a linear function.
Sample Prompts
- When x = 2.5, what is y in y = 2x + 5?
- Use the graph to estimate y when x = 3.2.
- Does the pattern between x and y remain constant between whole numbers?
- How can you confirm your calculated answer using the graph?
Why This Matters
Understanding that linear graphs represent continuous relationships helps learners interpret data, estimate unknowns, and understand real-world trends such as cost vs. time or distance vs. speed.
Prerequisite Knowledge Required
- Substituting into linear equations (from Functions 4A).
- Plotting and interpreting coordinates (from Functions 4B).
- Multiplying and adding decimals accurately.
- Recognising the link between equations and graphs.
Linked Phlows:
Functions 4A – Substituting into y = 4x – 3,
Functions 4B – Plotting Points for y = 3x + 4,
Co-ordinates 3F – Reading Axes Values and Scales.
Main Category
Algebra → Graphs and Linear Relationships
Estimated Completion Time
Approx. 10–14 seconds per question.
40 questions total → Total time: 7–10 minutes.
| Learner Profile | Estimated Time | Description |
|---|---|---|
| One Level Below | 9–10 mins | May need support multiplying decimals or reading fractional x-values. |
| At Level | 7–8 mins | Confidently transitions between graph, table, and equation with minor checks. |
| One Level Above | 5–6 mins | Interprets and predicts values mentally with strong spatial reasoning. |
Cognitive Load / Step Size
Moderate. The move from whole-number to decimal x-values increases abstraction slightly, but visuals (dotted lines and highlights) keep the reasoning grounded. This supports the concept of interpolation without cognitive overload.
Language & Literacy Demand
Low. The activity is numerically and visually driven, with minimal text. Visual guides and consistent colour cues direct attention to key steps (substitute → trace → read y).
Clarity & Design
- Equation → Table → Graph structure maintains logical flow.
- Purple dotted lines show connections between x and y visually.
- Minimal clutter keeps focus on interpreting relationships.
Curriculum Alignment (ROI Junior Cycle Mathematics)
- Strand: Algebra
- Strand Unit: Functions and Graphs
- Learning Outcomes:
- Use equations of the form y = mx + c to generate and interpret values.
- Read y-values from graphs for both integer and non-integer x.
- Recognise that linear relationships are continuous.
- Translate between algebraic, numerical, and graphical representations.
Engagement & Motivation
High. Students enjoy verifying their calculated answers visually and seeing patterns continue smoothly along the line.
Error Opportunities & Misconceptions
- Misreading graph scale or decimal spacing.
- Confusing x and y when tracing coordinates.
- Multiplying decimals incorrectly (e.g., 2 × 3.5 = 5.5).
- Assuming only integer coordinates belong to a function line.
Transferability / Real-World Anchoring
High. These skills apply to any context with continuous change — interpreting data in science experiments, reading financial trends, or predicting intermediate values in charts.
Conceptual vs Procedural Balance
Balanced, leaning conceptual. Learners practise substitution (procedural) but gain deeper conceptual understanding of linear continuity and proportional reasoning through visual reinforcement.
Learning Objectives Addressed
- Substitute decimal x-values into linear equations accurately.
- Read and confirm y-values from graphs.
- Recognise linear relationships as continuous patterns.
- Connect numeric, algebraic, and graphical reasoning fluently.
What Your Score Says About You
- Less than 20: Revisit substitution — practise connecting equations and graphs.
- 21–29: Good progress — check decimal calculations and scale reading.
- 31–39: Excellent grasp of both calculation and visual reasoning.
- 40 / 40: Outstanding — full fluency interpreting continuous linear relationships.