Functions 4D
Overview
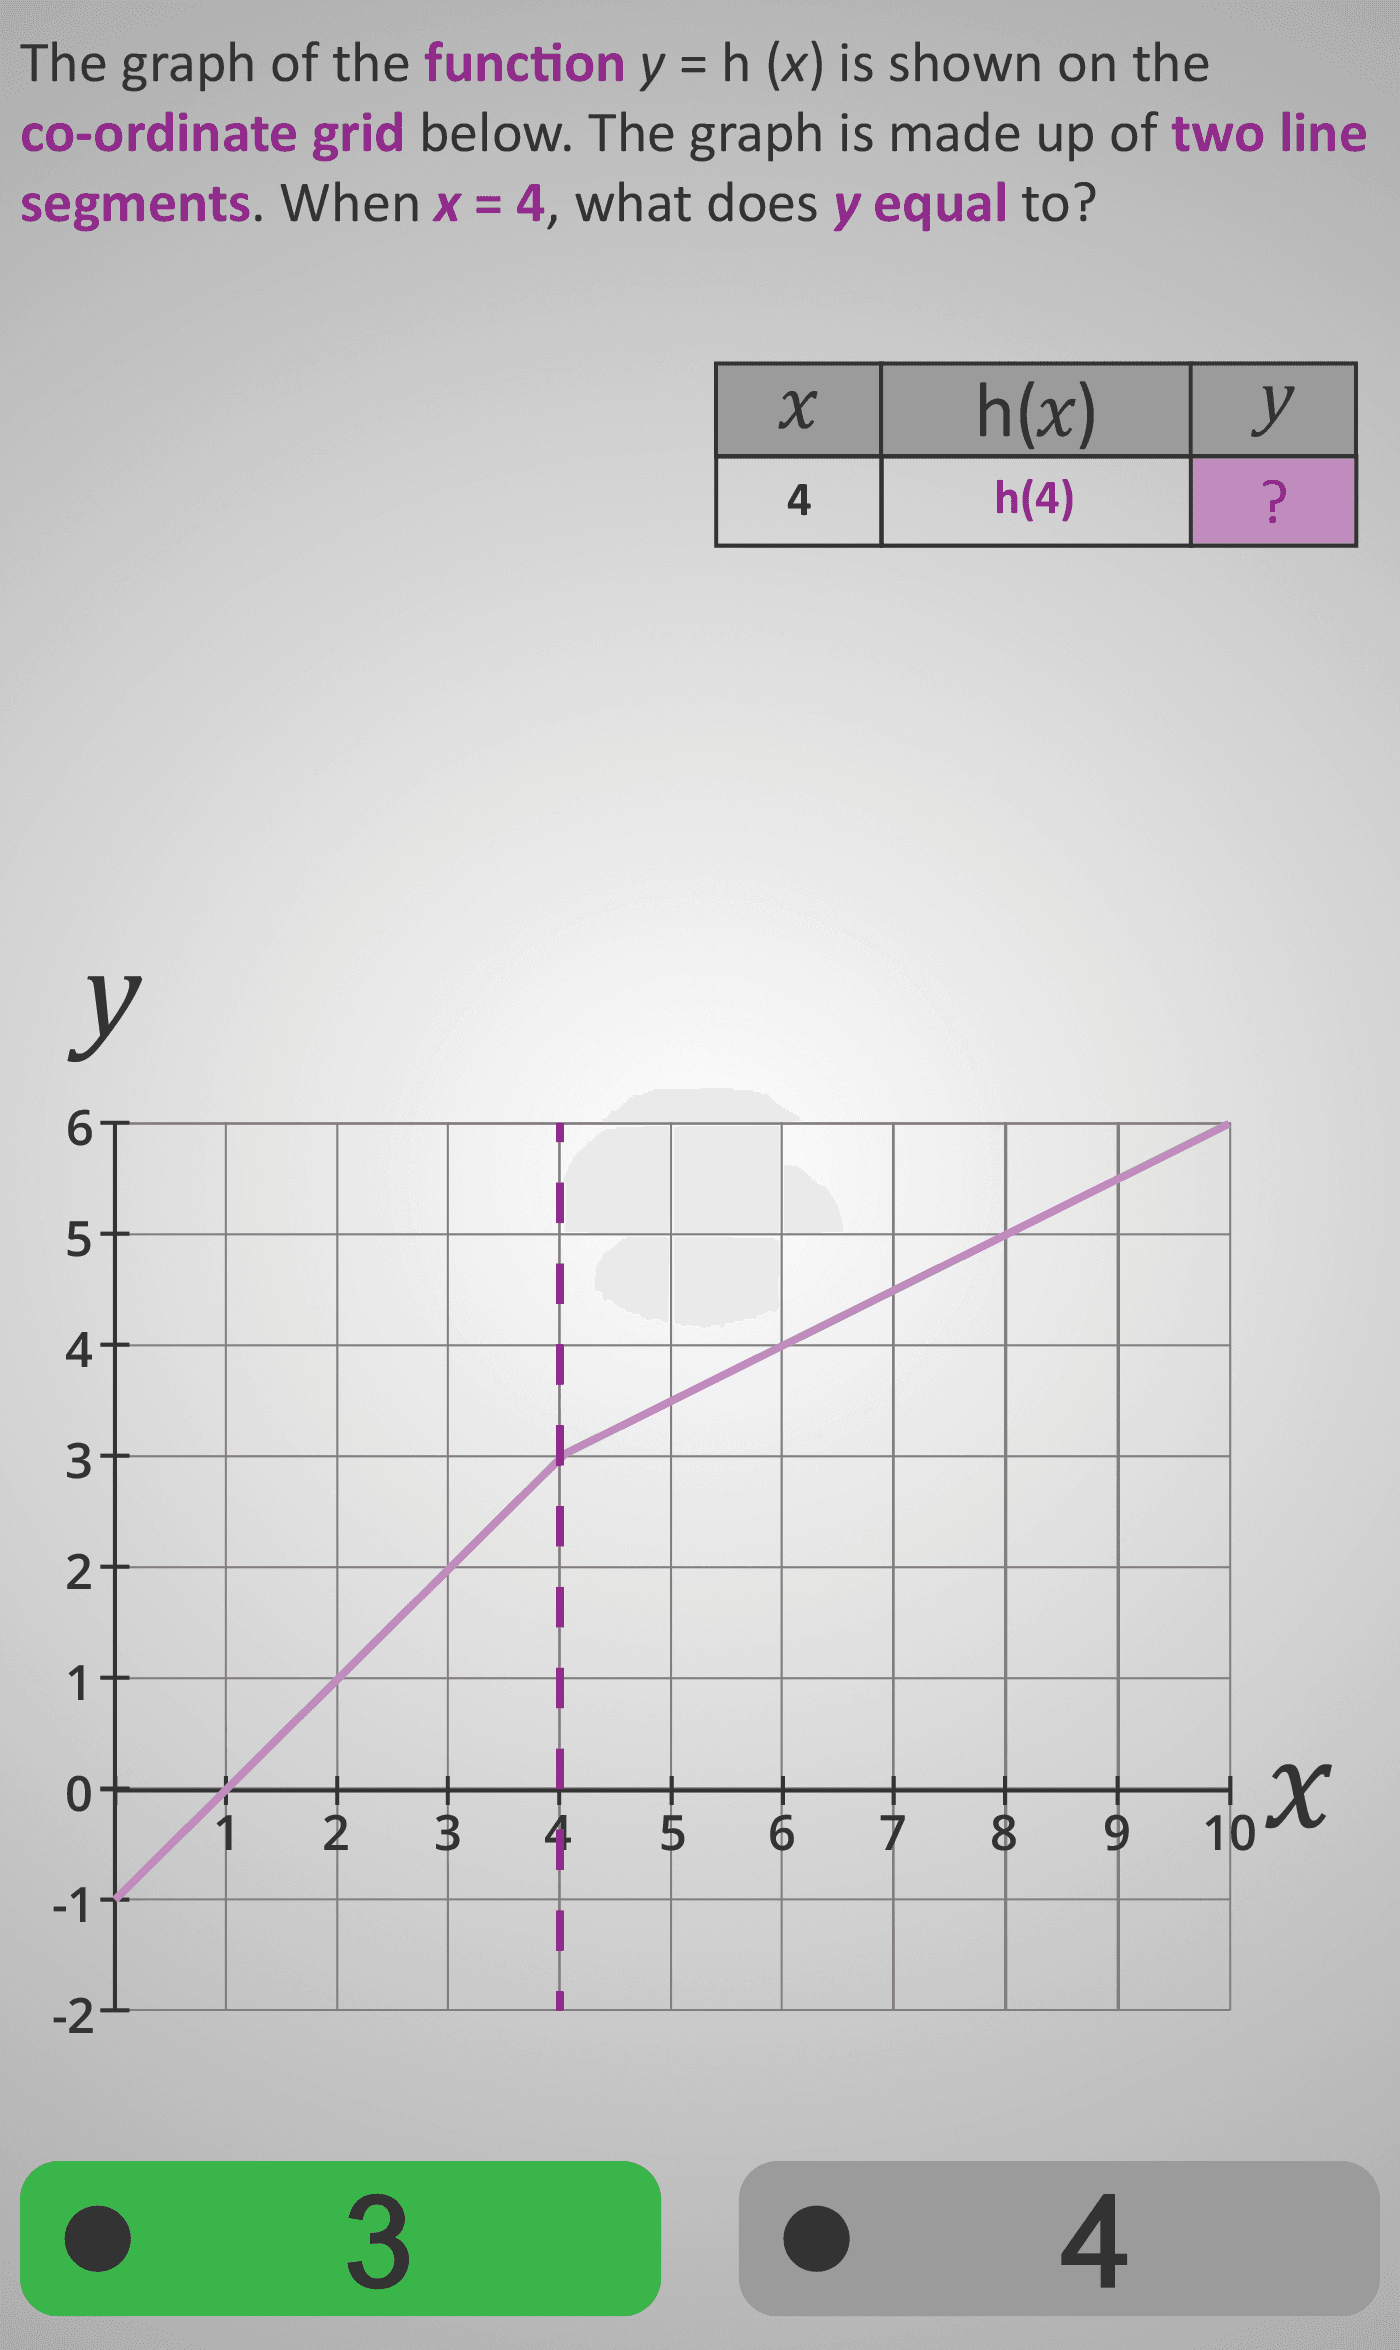
In this Phlow, learners explore piecewise linear functions — graphs made from two connected straight-line segments. The function is expressed as y = h(x), and students use the graph to find unknown values by tracing between the axes. Sometimes they find y for a given x, and other times x for a given y.
Each step reinforces that functions can have different rates across domains while still maintaining a single, connected relationship. Learners trace using dotted purple lines across and up/down the axes to locate coordinates accurately, developing inverse reasoning — switching between input (x) and output (y).
This activity builds visual fluency in interpreting graphs and prepares students for understanding non-linear, composite, and real-world data relationships.
Worked Example
Consider a function defined as:
      h(x) =
        2x + 1   for  x ≤ 3
        x + 4    for  x > 3
| x | h(x) | Line Segment |
|---|---|---|
| 1 | 3 | y = 2x + 1 |
| 3 | 7 | y = 2x + 1 |
| 4 | 8 | y = x + 4 |
| 5 | 9 | y = x + 4 |
Learners trace the point (x = 4, y = 8) on the graph and also answer inverse questions such as “When y = 6, what is x?”. They see how the slope changes but the graph remains continuous.
Sample Prompts
- When x = 2, what is y on the graph?
- When y = 8, what is x?
- Does the slope stay the same across the whole graph?
- What happens to y when the function switches at x = 3?
Why This Matters
Piecewise functions model real-world relationships such as tax rates, pricing brackets, or distance-time graphs. Understanding how rates change builds the foundation for interpreting complex functional and statistical relationships.
Prerequisite Knowledge Required
- Reading coordinates and understanding graph scales.
- Substituting into simple linear functions (Functions 4A–4C).
- Interpreting straight-line graphs accurately.
- Recognising that functions can change slope across intervals.
Linked Phlows:
Functions 4A–4C – Linear Graph Progression,
Co-ordinates 3F – Interpreting Grid Values,
Patterns 3D – Recognising Constant and Changing Differences.
Main Category
Algebra → Graphs and Functions
Estimated Completion Time
Approx. 10–14 seconds per question.
40 questions total → Total time: 7–10 minutes.
| Learner Profile | Estimated Time | Description |
|---|---|---|
| One Level Below | 9–10 mins | Needs support tracing carefully and interpreting slope changes. |
| At Level | 7–8 mins | Accurately reads both line segments and matches values confidently. |
| One Level Above | 5–6 mins | Interprets graphs mentally and predicts relationships efficiently. |
Cognitive Load / Step Size
Moderate to high. The two-segment graph introduces new conceptual weight, but visual scaffolds (dotted lines and labelled points) keep focus on understanding rate changes and direction. This Phlow encourages comparison, pattern recognition, and dual reasoning (x→y and y→x).
Language & Literacy Demand
Low. Mathematical terms (function, slope, equal to) are highlighted visually. Instructions are concise and rely heavily on graph-based comprehension, minimising reading load.
Clarity & Design
- Clean graph layout with purple-dotted tracing for clarity.
- Tables reinforce coordinate relationships.
- Subtle colour contrast highlights slope changes between segments.
Curriculum Alignment (ROI Junior Cycle Mathematics)
- Strand: Algebra
- Strand Unit: Functions and Graphs
- Learning Outcomes:
- Interpret and reason with piecewise linear functions.
- Read and estimate values from graphs for given x or y.
- Recognise and explain changes in slope or rate.
- Use graphs to connect algebraic and tabular representations.
Engagement & Motivation
High. The dynamic challenge of tracing both forward and backward on a two-part graph creates curiosity and deepens understanding of how graphs describe real phenomena.
Error Opportunities & Misconceptions
- Assuming the graph has one uniform slope.
- Mixing up x and y when tracing inversely.
- Reading from incorrect segment or interval.
- Assuming all graphs are straight or symmetrical.
Transferability / Real-World Anchoring
High. Models real-life relationships such as taxi fares, temperature changes, or stepwise tariffs — where the rate changes after a threshold.
Conceptual vs Procedural Balance
Conceptual focus. The emphasis is on interpreting how different segments represent changing rules rather than performing algebraic calculations.
Learning Objectives Addressed
- Interpret graphs representing piecewise functions.
- Find unknown x or y values by reading accurately from a graph.
- Recognise slope changes and rate variation across segments.
- Link algebraic, graphical, and tabular forms of functional relationships.
What Your Score Says About You
- Less than 20: Practise tracing between x and y — focus on interpreting rate changes.
- 21–29: You understand the concept but may mix segments or scales.
- 31–39: Strong interpretation — accurately reads and analyses rate differences.
- 40 / 40: Excellent! You can reason both forward and backward across multi-rate graphs.