Median 4B
Overview
In this Phlow, learners apply the median method to larger data sets, building on the foundations from Median 4A. They follow a structured, visual process to identify the central value in ordered data, reinforcing logic, accuracy, and conceptual understanding of central tendency.
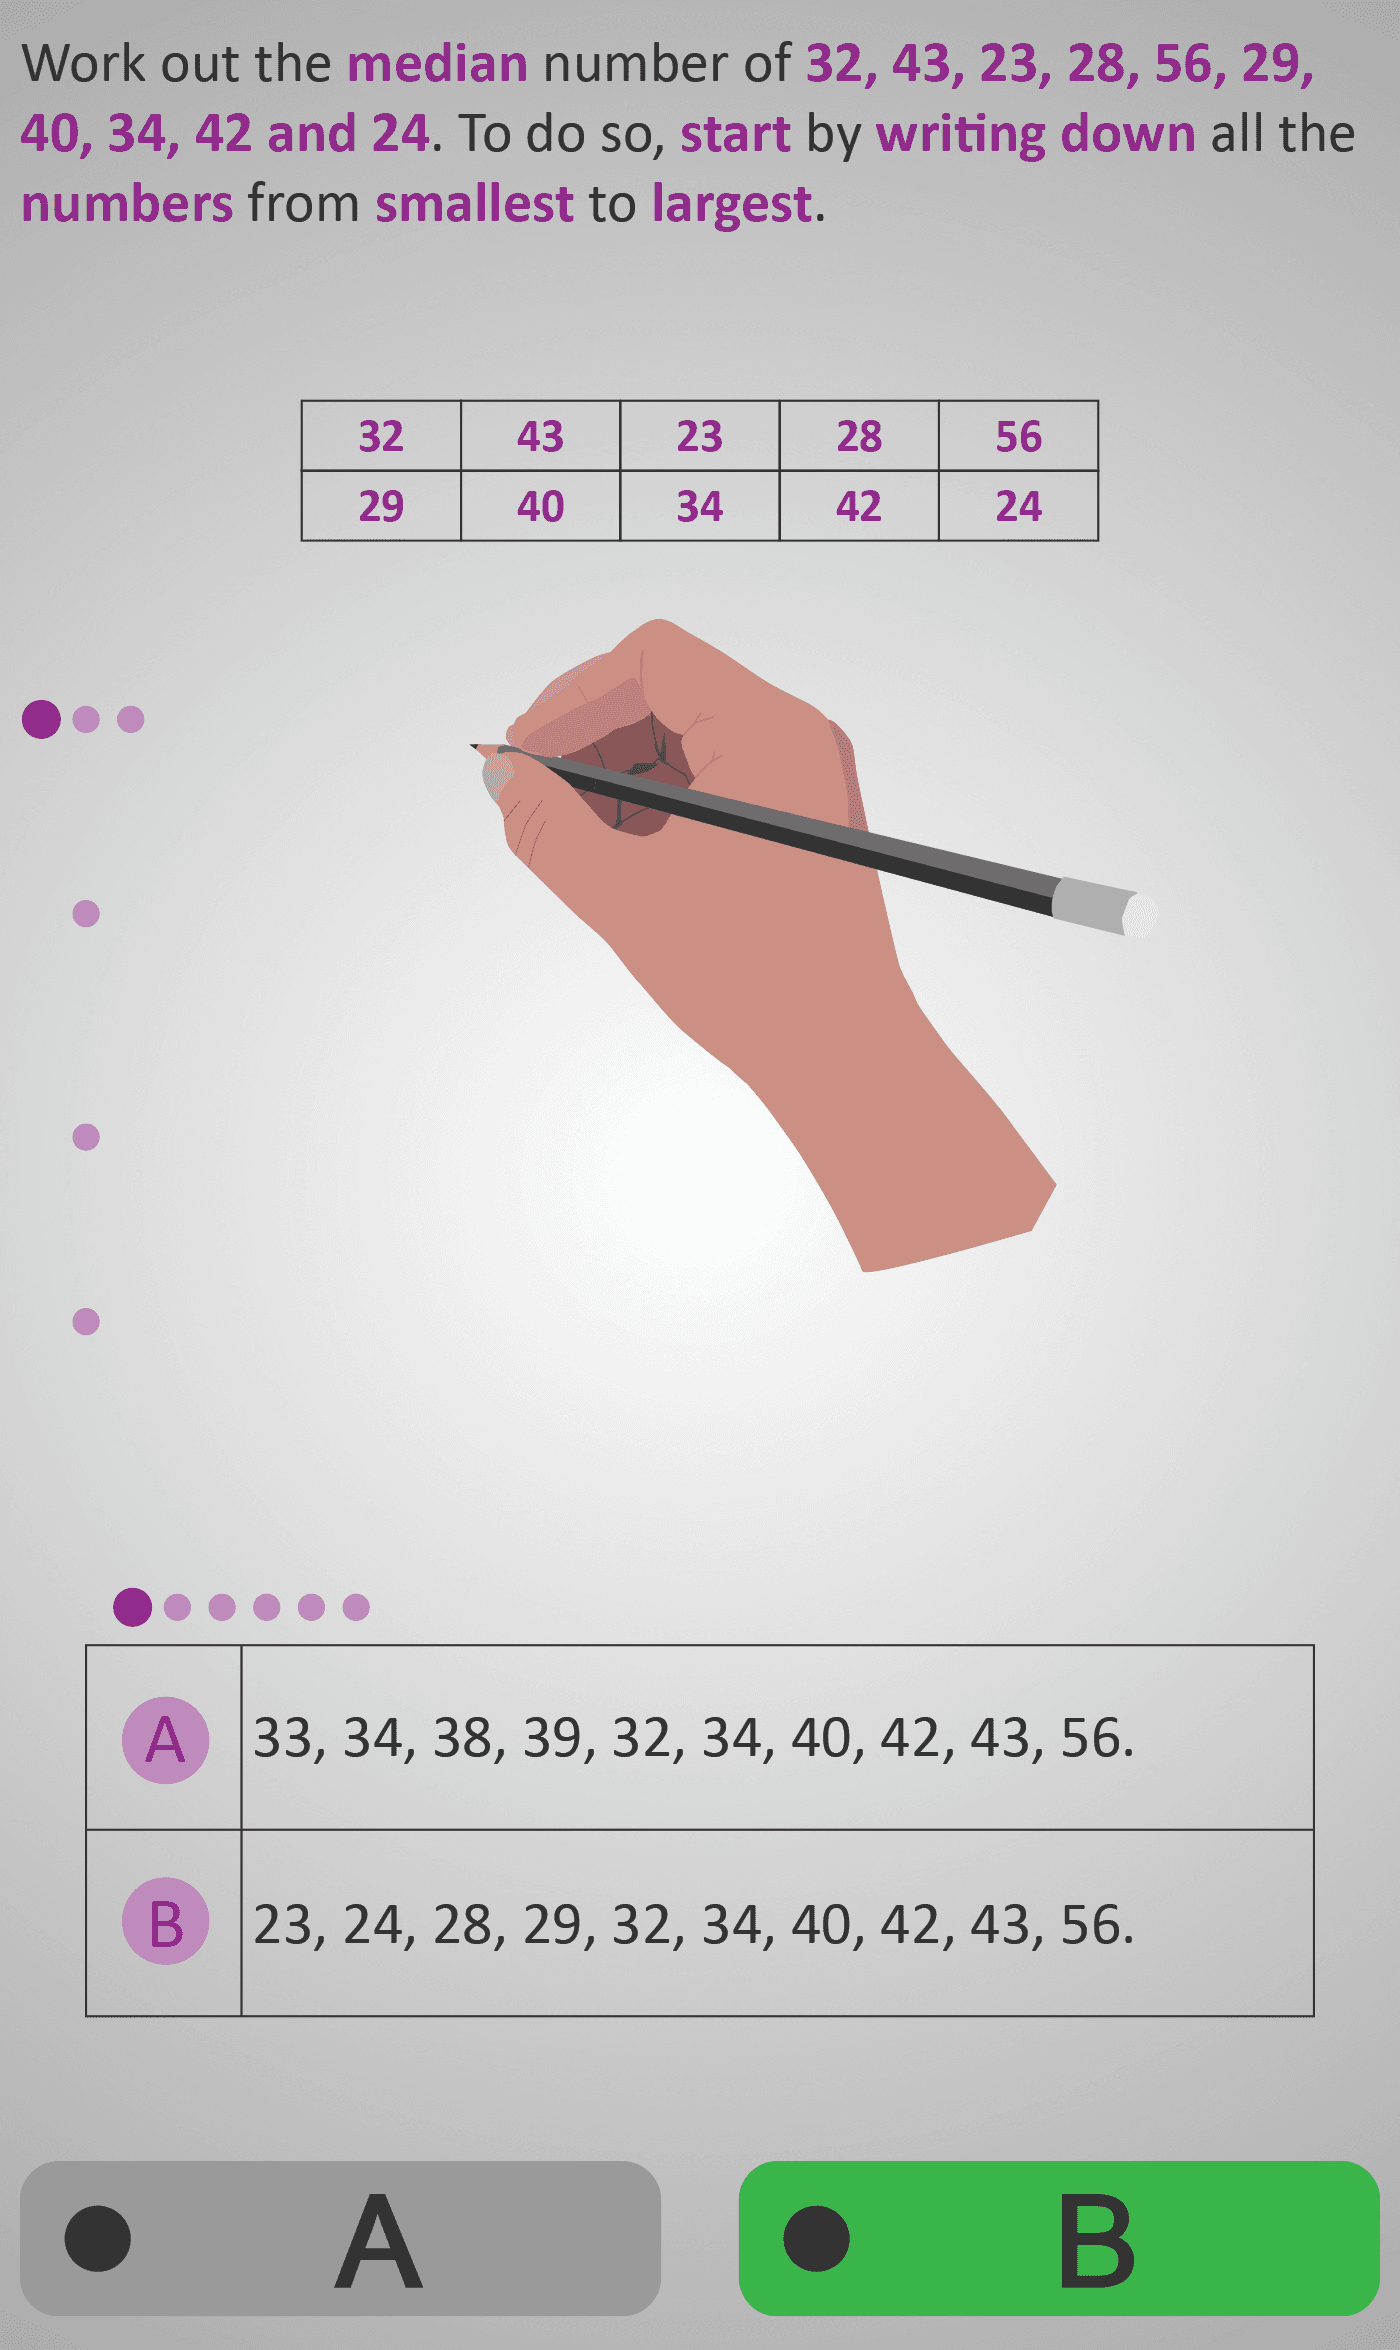
Using the example set 23, 24, 28, 29, 32, 34, 40, 42, 43, 56, students learn to:
- Write the numbers in order (ensuring none are missed).
- Cross out the outer pairs step-by-step — lowest with highest — until two numbers remain (32 and 34).
- Add the two middle values and divide by 2: (32 + 34) ÷ 2 = 33.
This Phlow emphasises why the median represents the central point in a data set rather than the extremes. Each stage is demonstrated visually through handwriting and crossing actions, supporting both procedural and conceptual learning.
Worked Example
Example: Find the median of 11, 14, 16, 18, 21, 23, 26, 29.
      Step 1: Order → 11, 14, 16, 18, 21, 23, 26, 29
      Step 2: Cross out from both ends → 11 & 29, 14 & 26, 16 & 23
      Step 3: Remaining middle numbers → 18 and 21
      Step 4: Add and divide → (18 + 21) ÷ 2 = 19.5
      Median = 19.5
Sample Prompts
- What are the two middle numbers in this set?
- Why is it important to order the numbers first?
- What does the median tell us about the data?
- How is the median different from the mean?
Why This Matters
Finding the median is a foundational statistical skill used in everyday contexts such as salaries, test results, and surveys. This Phlow helps learners visualise fairness and balance in data, while reinforcing arithmetic fluency and analytical thinking.
Prerequisite Knowledge Required
- Ability to order a list of numbers accurately.
- Fluency in addition and division operations.
- Familiarity with the “crossing-out from both ends” method (introduced in Median 4A).
Linked Phlows:
Median 4A – Median of a Small Data Set,
Mean 3A – Averaging Basics,
Order 3B – Arranging Numbers.
Main Category
Statistics → Measures of Central Tendency
Estimated Completion Time
Approx. 10–14 seconds per question.
40 questions total → Total time: 7–10 minutes.
| Learner Profile | Estimated Time | Description |
|---|---|---|
| One Level Below | 9–10 mins | Needs extra time to organise data or check ordering accuracy. |
| At Level | 7–8 mins | Performs ordering, crossing, and averaging accurately with moderate pacing. |
| One Level Above | 5–6 mins | Identifies central values intuitively and explains reasoning clearly. |
Cognitive Load / Step Size
Moderate to slightly high. The increase in data size introduces mild complexity but the familiar, repeated structure (order → cross → calculate) ensures steady cognitive pacing. Visual cues and animations support sustained attention and error prevention.
Language & Literacy Demand
Moderate. Sentences are short and procedural. Key words such as “smallest,” “largest,” “median,” and “divide” are colour-highlighted in purple. The emphasis is on visual logic rather than text comprehension.
Clarity & Design
- Clear handwriting animation mirrors classroom teaching flow.
- Purple cross lines visually track the process of elimination.
- Fraction steps and operations are neatly aligned for readability.
- Calm, uncluttered background supports sustained concentration.
Curriculum Alignment (ROI Junior Cycle Mathematics)
- Strand: Statistics and Probability
- Strand Unit: Representing and Interpreting Data
- Learning Outcomes:
- Calculate the median for larger and even-numbered data sets.
- Arrange data in order prior to analysis.
- Understand that the median is less affected by extreme values than the mean.
- Apply systematic approaches to find central values.
Engagement & Motivation
Strong. The structured, puzzle-like process of narrowing down the data set keeps learners engaged. Realistic examples (e.g., scores, measurements) make the concept practical and relatable.
Error Opportunities & Misconceptions
- Omitting numbers when ordering the data set.
- Crossing from the middle outward instead of from ends inward.
- Miscounting or pairing incorrectly in larger sets.
- Failing to divide by 2 when finding the median of two middle values.
Transferability / Real-World Anchoring
Excellent. The ability to identify the median supports understanding of median salaries, test scores, and performance data — essential for interpreting reports and making data-driven decisions.
Conceptual vs Procedural Balance
Balanced with a conceptual emphasis. The Phlow develops fluency through repetition while ensuring students understand the purpose and meaning behind each operation. The link between arithmetic and fairness is made explicit.
Learning Objectives Addressed
- Order larger data sets systematically before analysis.
- Apply the “cross from both ends” method to locate central values.
- Calculate the mean of two central values to find the median.
- Explain why the median is more robust to outliers than the mean.
What Your Score Says About You
- Less than 20: You may be missing numbers or steps — focus on ordering carefully and crossing systematically.
- 21–29: You understand the process but occasionally make arithmetic or counting errors.
- 31–39: You find medians accurately and can explain your reasoning.
- 40 / 40: Excellent — complete fluency and understanding across varied data sets.