Patterns 4C
Overview
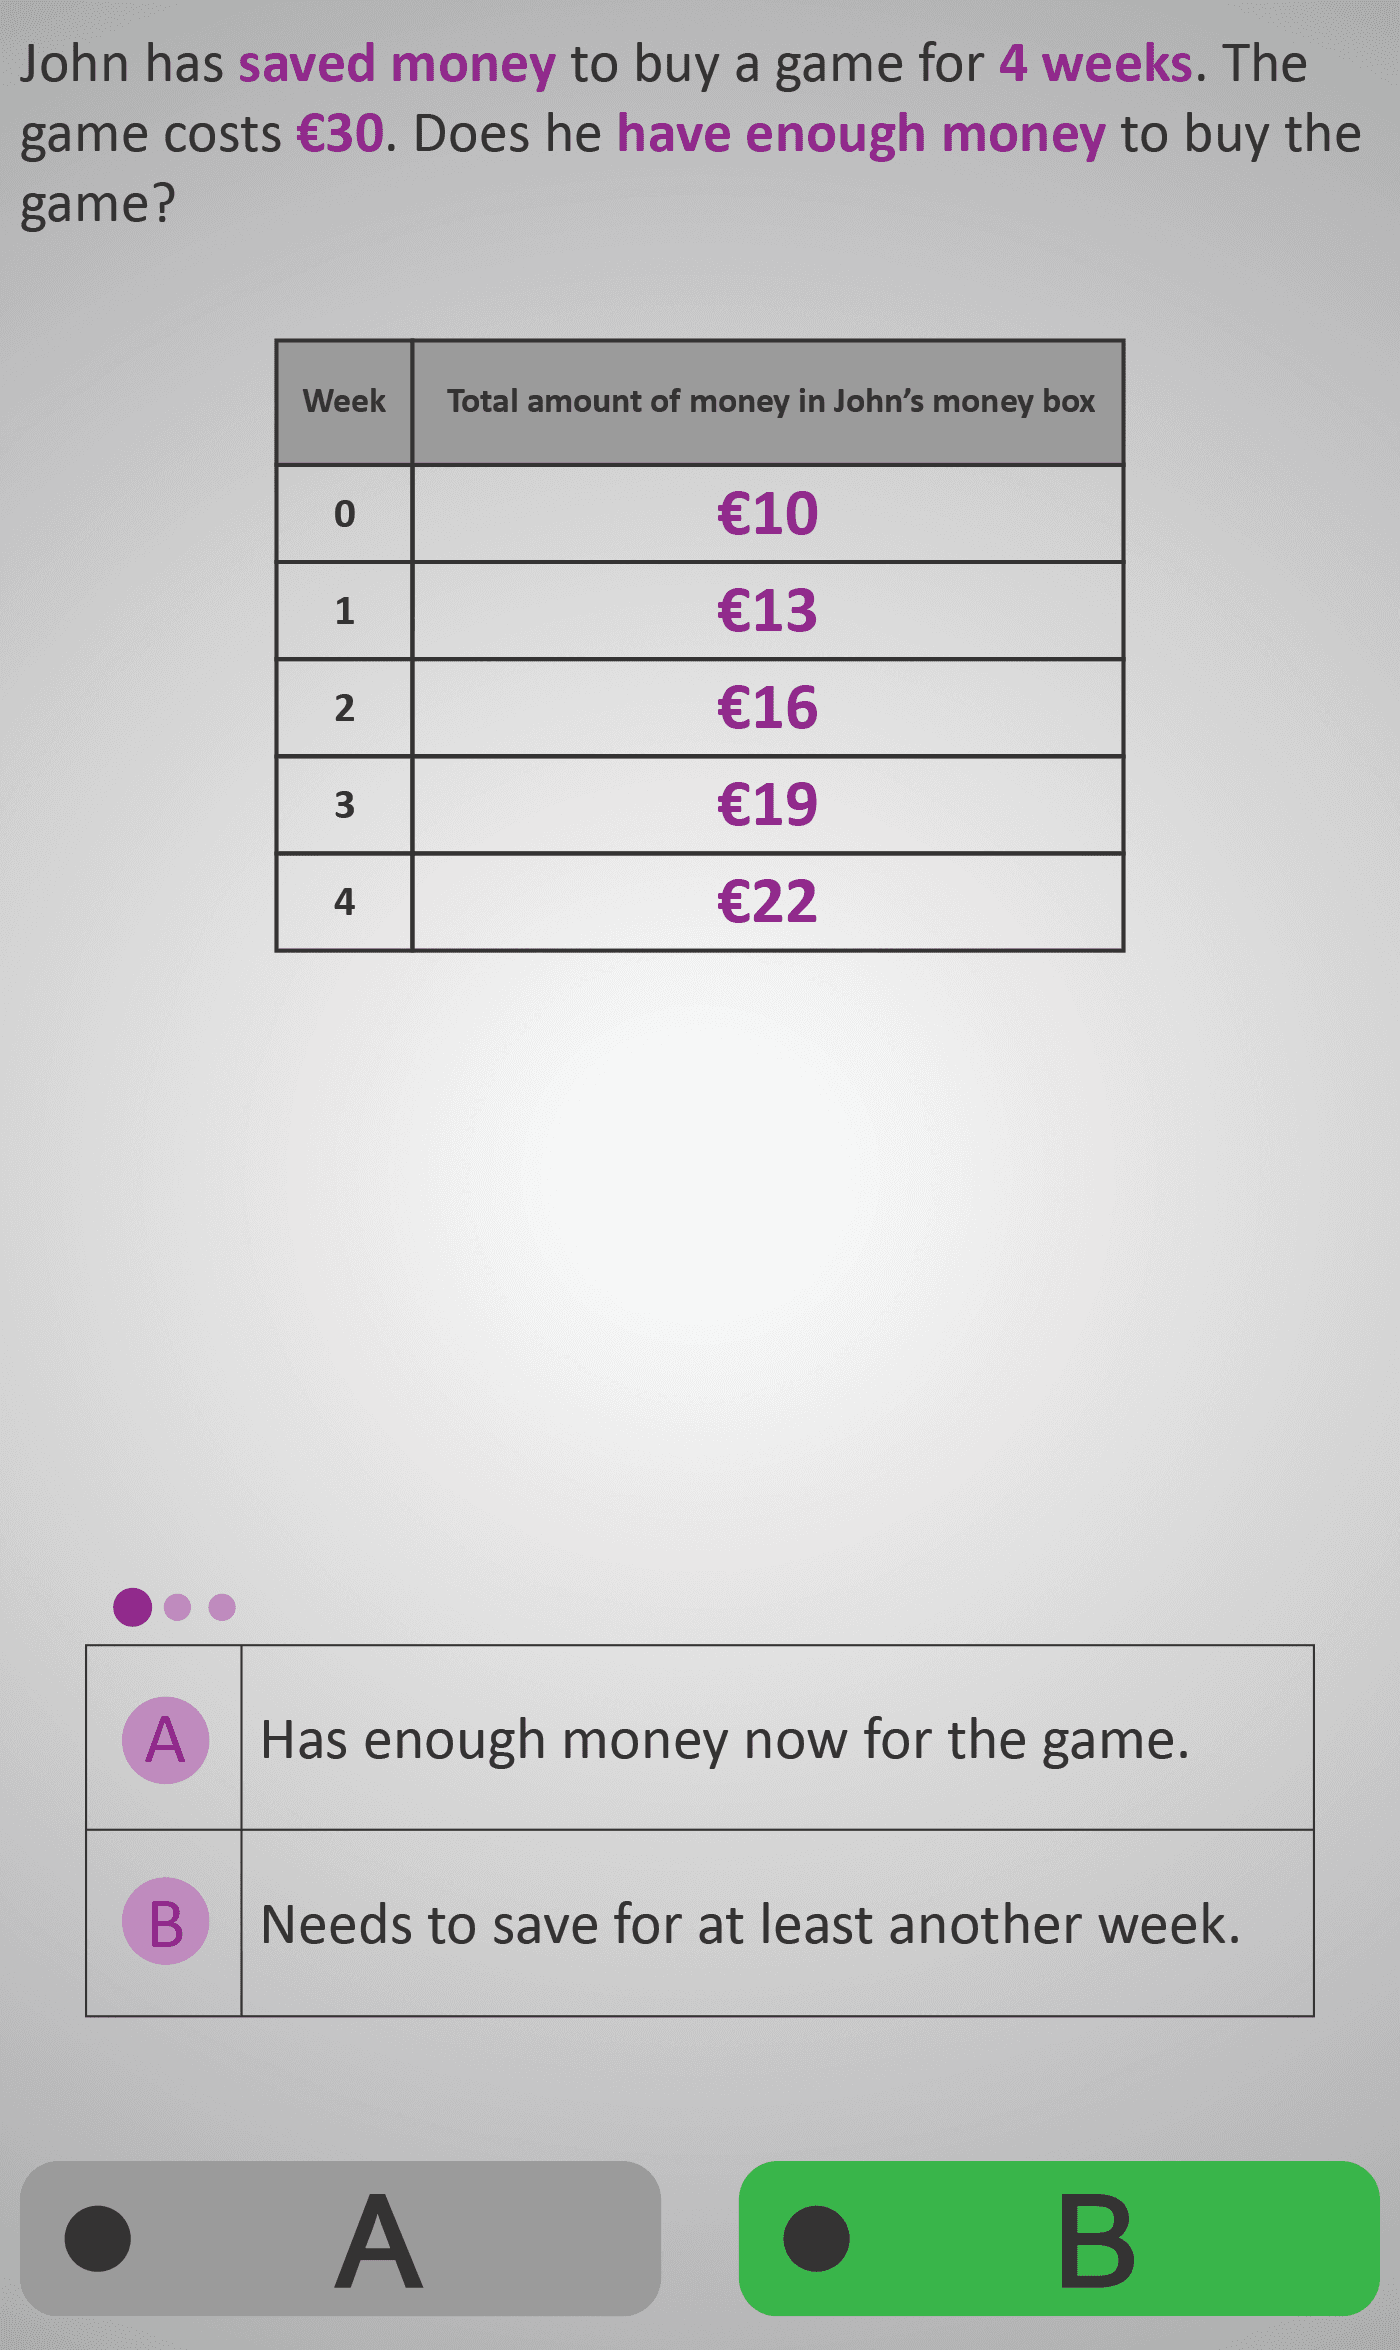
In this Phlow, learners transition from visual and fractional patterns to numerical sequences grounded in a real-life scenario. The example follows John’s weekly savings plan, displayed in a simple two-column table showing week number and total savings (€).
Learners analyse how the amount increases by a constant value each week (e.g., “add €3”), identify when specific goals are reached, and determine whether the current total is enough to afford a target item. Each question asks learners to apply pattern reasoning to predict and compare values beyond those shown.
The scenario makes the abstract concept of arithmetic sequences meaningful by tying it to practical, goal-oriented reasoning. Students develop a concrete sense of linear growth before encountering formal algebraic notation.
Worked Example
      John's Savings:

      Week | Total (€)
       1   | 10
       2   | 13
       3   | 16
       4   | 19
       5   | ?

      Rule: Add €3 each week.

      Q: How much will John have after 5 weeks?
      A: €22

      Q: The game costs €20. Can he afford it after Week 4?
      A: No, because €19 < €20.
Sample Prompts
- How much does John save each week?
- After how many weeks will he reach €25?
- Can he afford the game in Week 4 or Week 5?
- What rule describes how his savings grow?
Why This Matters
This Phlow helps learners connect mathematical reasoning to financial literacy. They see how patterns apply to everyday goals and money management while building readiness for algebraic sequences and graph interpretation.
Prerequisite Knowledge Required
- Recognise and extend simple addition patterns.
- Read and interpret data presented in tables.
- Understand that regular increases form a pattern or rule.
Linked Phlows:
Patterns & Sequences 4A – Visual growth patterns,
Patterns & Sequences 4B – Fractional and numerical term growth,
Money 3C – Counting euro and identifying changes in value.
Main Category
Algebra → Arithmetic Sequences / Functional Relationships
Estimated Completion Time
Approx. 10–14 seconds per question.
40 questions total → Total time: 7–10 minutes.
| Learner Profile | Estimated Time | Description |
|---|---|---|
| One Level Below | 9–10 min | Needs to refer back to the table frequently and confirm week-by-week totals. |
| At Level | 7–8 min | Understands the rule and predicts new values smoothly. |
| One Level Above | 5–6 min | Applies the additive rule mentally and generalises to unseen terms. |
Cognitive Load / Step Size
Moderate. Each step isolates one decision — identifying the rule, extending it, or comparing totals to a target. The realistic context and table layout reduce extraneous load, helping students focus on pattern recognition and application.
Language & Literacy Demand
Medium. Short questions use everyday vocabulary (saved, weeks, enough, cost) with key values highlighted in purple. The structured table minimises reading load while maintaining real-world phrasing for context-rich comprehension.
Clarity & Design
- Two-column table (Week | Total) presents growth clearly.
- Purple accents highlight monetary values and pattern differences.
- Minimalist layout ensures focus on number logic and goal reasoning.
- Progress dots show learner advancement through micro-steps.
Curriculum Alignment (ROI Junior Cycle Mathematics)
- Strand: Algebra / Number
- Strand Unit: Patterns and Relationships
- Learning Outcomes:
- Recognise and describe numerical patterns in practical contexts.
- Represent relationships in tables and use them for prediction.
- Relate repeated addition to the concept of a pattern rule.
- Interpret functional relationships in real-life scenarios.
Engagement & Motivation
The relatable savings goal gives immediate purpose — students empathise with John’s goal and feel motivated to calculate when he can afford the game. The context naturally maintains flow and curiosity by tying math to personal decision-making.
Error Opportunities & Misconceptions
- Starting the count from Week 1 instead of Week 0.
- Confusing additive and multiplicative patterns.
- Overlooking that the total includes initial savings (e.g., starting €10).
- Misinterpreting “enough” (≥ vs >).
Transferability / Real-World Anchoring
High. Directly applies to budgeting, saving, and financial planning. Builds foundation for understanding linear growth and basic functions used in real-world data and business contexts.
Conceptual vs Procedural Balance
Balanced. Procedural practice (adding, reading tables) is matched with conceptual reflection (“what does this increase mean?”). Learners move naturally from counting patterns to reasoning about relationships.
Learning Objectives Addressed
- Recognise and describe arithmetic patterns in everyday contexts.
- Use tables to record and interpret data growth over time.
- Apply additive reasoning to predict and compare outcomes.
- Relate number patterns to practical decision-making (saving, goals, costs).
What Your Score Says About You
- Less than 20: You notice the pattern but struggle to apply it consistently — recheck how totals increase week by week.
- 21–29: You follow the rule but may mix up timing or totals — double-check your table references.
- 31–39: You interpret the rule confidently and can make accurate predictions — solid additive reasoning.
- 40 / 40: Mastery — you instantly recognise linear growth and could represent it algebraically or graphically.