Pie Chart 4A
Overview
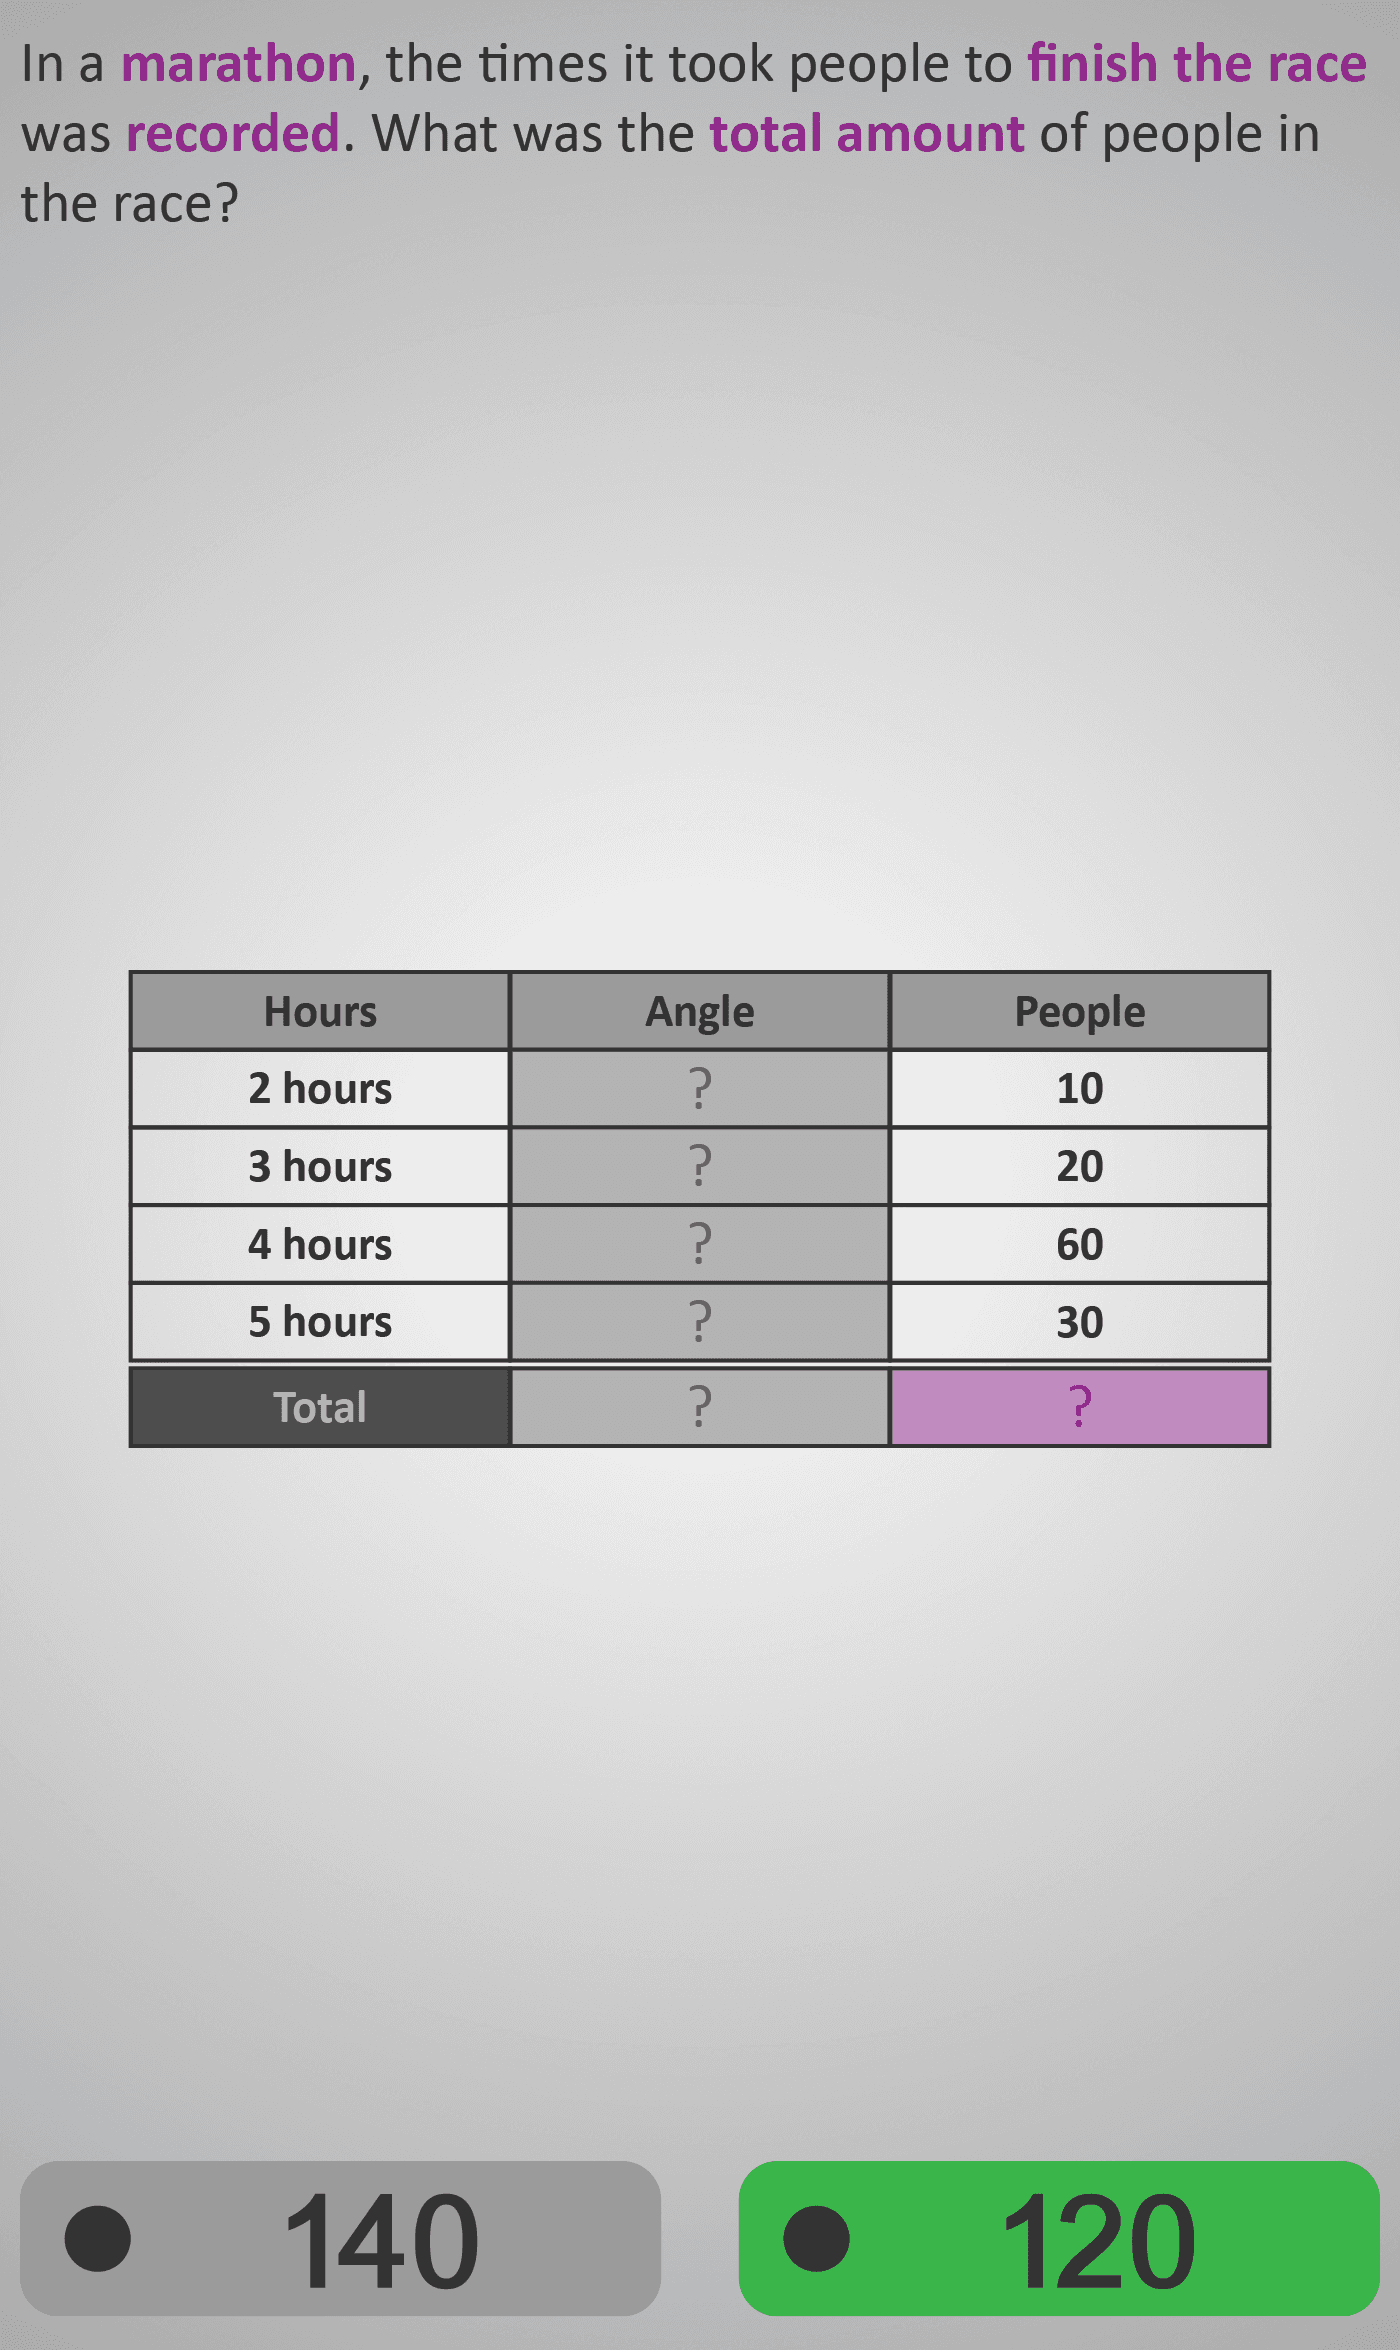
In this Phlow, learners explore how numerical data can be represented as pie charts. Each activity connects a simple data table (e.g., Hours / People) to angles in a full circle (360°), helping students understand the link between fractions, percentages, and degrees.
The Phlow begins by reinforcing that a circle equals 360°, then guides learners through calculating each category’s angle using proportional reasoning:
Angle = (Value ÷ Total) × 360°
Learners then decide which pie-chart option (A or B) correctly represents the data, or work backwards to determine missing values when angles are given. This two-way reasoning strengthens both conceptual understanding and procedural fluency.
Each screen uses consistent table and chart layouts with clear visual highlights — ensuring focus remains on reasoning about proportions rather than on deciphering new diagrams each time.
Worked Example
      Category   |  People
      -------------------
      Walking    |   6
      Running    |   9
      Cycling    |   5
      -------------------
      Total      |   20

      Step 1: Find each fraction
      Running = 9/20 of the total

      Step 2: Convert to angle
      (9/20) × 360° = 162°

      Step 3: Identify correct chart
      Chart A shows the running segment ≈ 162°, so A is correct.
Sample Prompts
- What fraction of the total does this category represent?
- How many degrees should this slice cover?
- Which chart (A or B) correctly represents the data?
- If one slice is 72°, how many people does that represent?
Why This Matters
Pie charts are among the most common ways data is shown in everyday life — from news reports to surveys and spending breakdowns. Understanding how to create and interpret them helps learners build data literacy and apply proportional reasoning beyond the classroom.
Prerequisite Knowledge Required
- Recognise that a full circle measures 360°.
- Understand fractions and ratios as parts of a whole.
- Be able to calculate proportional relationships.
- Read and interpret numerical tables.
Linked Phlows:
Fractions 3D – Fractions as Parts of a Whole,
Angles 3C – Measuring Angles in a Circle,
Bar Charts 4A – Interpreting Data in Charts.
Main Category
📊 Data & Statistics
Estimated Completion Time
Approx. 10–14 seconds per question.
40 questions total → Total time: 7–10 minutes.
Cognitive Load / Step Size
Well-paced and structured. Learners start by recognising totals and move step-by-step to calculating proportions and interpreting full charts. Each question introduces one small conceptual shift — maintaining engagement without cognitive overload.
Language & Literacy Demand
Moderate. Questions use clear, consistent phrasing (“Which pie chart shows the data correctly?”). Since visuals carry most of the meaning, learners with weaker literacy can still reason accurately through pattern and number.
Clarity & Design
- Alternating table highlights indicate the active category.
- Pie charts are clean, evenly scaled, and free of unnecessary decoration.
- Labels A and B provide visual comparison for reasoning questions.
- Colour-coding supports intuitive matching between data and chart segments.
Curriculum Alignment (ROI Junior Cycle Mathematics)
- Strand: Data and Chance
- Learning Outcome: Represent data using bar charts, line plots, and pie charts. Interpret data sets using fractions, percentages, and circular measures.
Engagement & Motivation
Contextualised datasets (e.g., time spent running, cycling, or resting) make the learning meaningful. The “Which of A or B is correct?” comparisons add a playful, competitive element that reinforces accuracy and confidence.
Error Opportunities & Misconceptions
- Mixing up values and degrees when calculating.
- Forgetting that a full circle equals 360°.
- Misreading which sector label corresponds to each category.
- Estimating proportions visually instead of calculating them numerically.
Transferability / Real-World Anchoring
Highly transferable. Skills apply directly to interpreting real-life data such as budgets, polls, and surveys — foundational for statistical literacy and critical thinking.
Conceptual vs Procedural Balance
Balanced. Conceptual understanding of part–whole relationships is integrated with procedural fluency in calculating and interpreting angles. Students don’t just memorise — they understand why each step works.
Learning Objectives Addressed
- Recognise that 360° represents a whole circle in pie charts.
- Calculate angles from data proportions using ratios or fractions.
- Interpret and compare data represented in circular form.
- Match correct charts to given data sets with accuracy.
What Your Score Says About You
- Less than 20: You can read charts but need more practice converting data to degrees.
- 21–29: You’re connecting fractions and angles — keep practising proportional reasoning.
- 31–39: Strong understanding — you interpret most charts accurately.
- 40 / 40: Mastery — you can confidently create and interpret pie charts from any data table.