Pie Chart 4B
Overview
In this Phlow, learners extend their understanding of pie charts from calculating single angles (4A) to interpreting full datasets. They work with a survey about students’ favourite hobbies and must find missing angles, total values, and identify which hobby is most or least popular.
Each step builds logically:
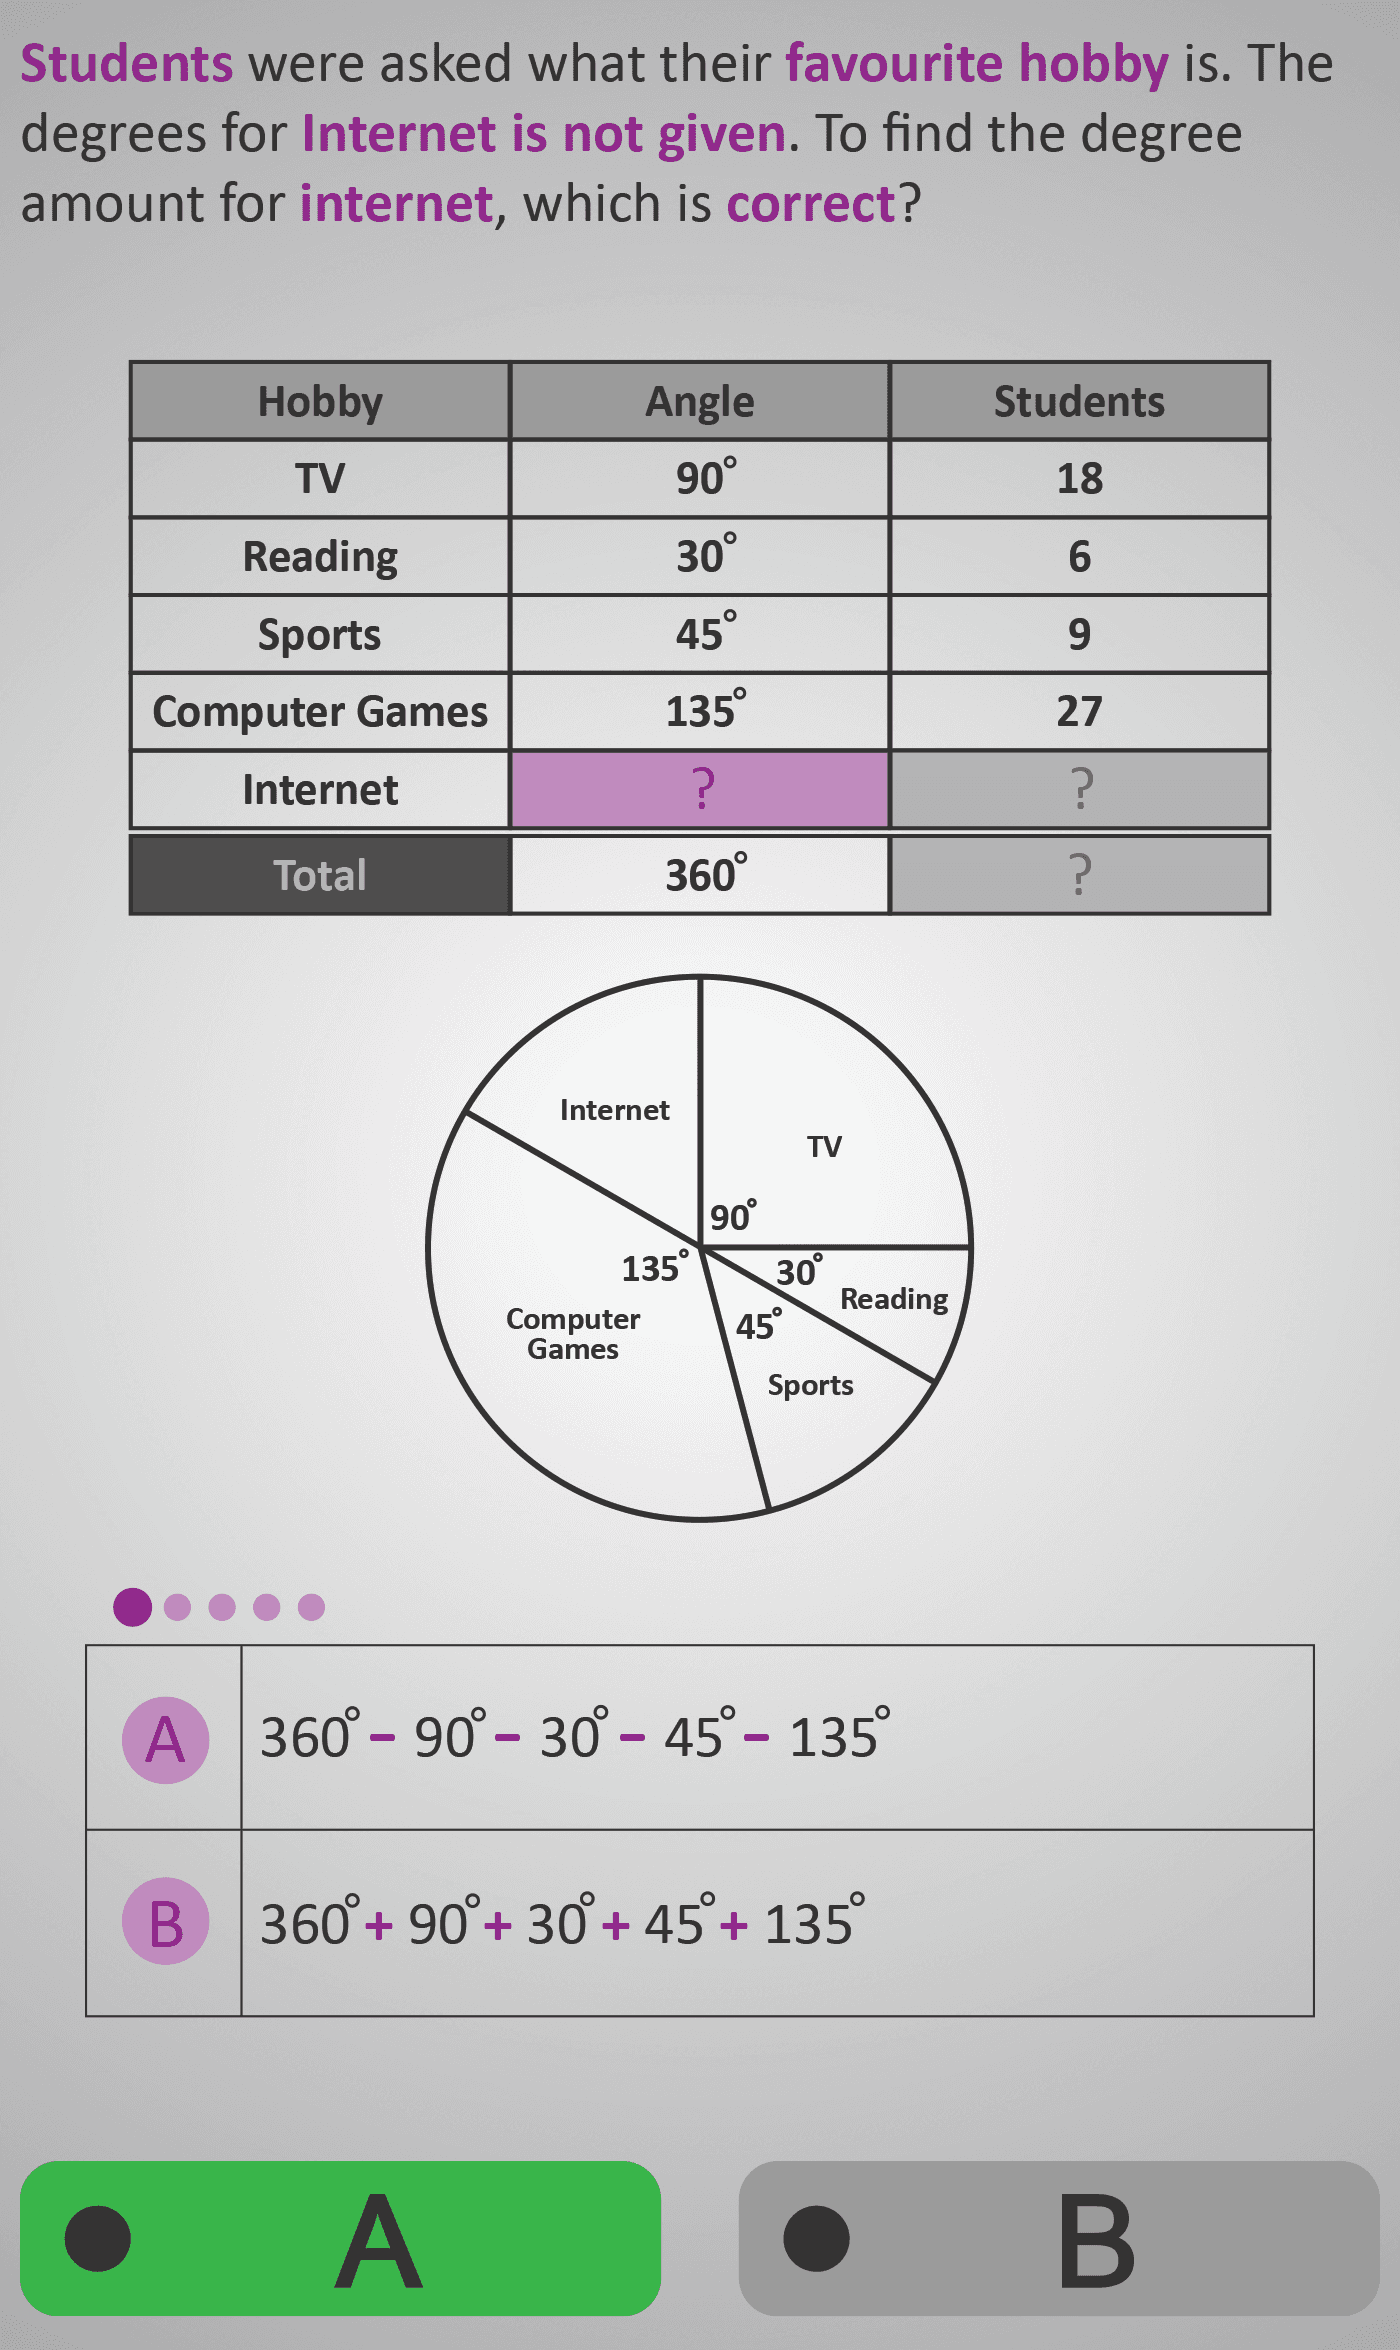
- Use subtraction to find missing angles (e.g., 360° – known angles = missing section).
- Convert between angles and number of students using proportional reasoning.
- Calculate the total number of participants from known parts.
- Interpret the chart to determine which category is most or least popular.
Worked Example
      Hobbies:
      Reading – 120°
      Sports  – 100°
      Music   – 80°
      Internet – ?

      Step 1: Find missing angle
      360° – (120° + 100° + 80°) = 60°

      Step 2: Find number of students for each angle
      If 60° = 6 students, then 1° = 0.1 student → Reading (120°) = 12 students

      Step 3: Identify most popular
      Reading = 12 students → Most popular hobby.
Sample Prompts
- What is the missing angle for “Internet”?
- How many students does a 60° sector represent?
- What is the total number of students surveyed?
- Which hobby is most popular overall?
Why This Matters
This Phlow builds a bridge between numerical proportion and visual data interpretation. Students not only compute angles and totals, but also learn to reason from real-world survey data — a skill essential for understanding charts in media, research, and everyday decisions.
Prerequisite Knowledge Required
- Recognise that 360° represents a full circle.
- Subtract angles to find missing portions.
- Understand ratios and proportions:
Value = (Angle ÷ 360°) × Total
- Read and interpret tables and charts confidently.
Linked Phlows:
Pie Chart 4A – Calculating Angles from Data,
Angles 3C – Using 360° in a Circle,
Fractions 3D – Proportional Relationships.
Main Category
📊 Data & Statistics
Estimated Completion Time
Approx. 10–14 seconds per question.
40 questions total → Total time: 7–10 minutes.
Cognitive Load / Step Size
Moderate and progressive. The sequence moves from subtraction to proportional reasoning, then to qualitative comparison. Each step adds one manageable layer of complexity, ensuring deep understanding without overwhelming learners.
Language & Literacy Demand
Moderate. Text prompts are short and contextualised (“Which hobby is most popular?”), supporting engagement without raising reading demand. Diagrams and tables provide most of the meaning visually.
Clarity & Design
- Pie charts use consistent colour-coding to match table rows.
- Alternating table highlights show active data categories.
- Clear subtraction and proportion layouts mirror circular structure.
- Purple emphasis draws focus to key numerical values.
Curriculum Alignment (ROI Junior Cycle Mathematics)
- Strand: Data and Chance
- Learning Outcomes: Interpret and analyse data in graphical form, use proportional reasoning to relate parts to a whole, and represent data using pie charts.
Engagement & Motivation
The relatable “favourite hobby” context adds personal meaning. Students can visualise how class survey data translates to circle segments, promoting curiosity about real-world data representation and interpretation.
Error Opportunities & Misconceptions
- Forgetting total = 360°.
- Adding instead of subtracting to find missing angles.
- Confusing number of students with angle measure.
- Mixing up category labels or pie sectors.
Transferability / Real-World Anchoring
Highly transferable. These reasoning skills apply to survey analysis, financial breakdowns, time allocation, and media data visualisation — all common real-world applications of pie charts.
Conceptual vs Procedural Balance
Balanced. Students combine conceptual understanding of 360° as a whole with procedural skills in subtraction, ratio calculation, and data interpretation. The final reasoning step (“Which hobby is most popular?”) ensures conceptual consolidation.
Learning Objectives Addressed
- Calculate missing angles or values in pie charts.
- Apply ratios and proportions to interpret data accurately.
- Identify most and least popular categories in datasets.
- Link numerical reasoning to real-world survey contexts.
What Your Score Says About You
- Less than 20: You can read data but need more practice calculating proportions and totals.
- 21–29: You understand pie charts but may miss small subtraction or angle details.
- 31–39: You interpret data accurately and connect visuals to numbers effectively.
- 40 / 40: Mastery — you can fully connect numerical data, proportions, and visual representation in pie charts.