Pie Chart 4C
Overview
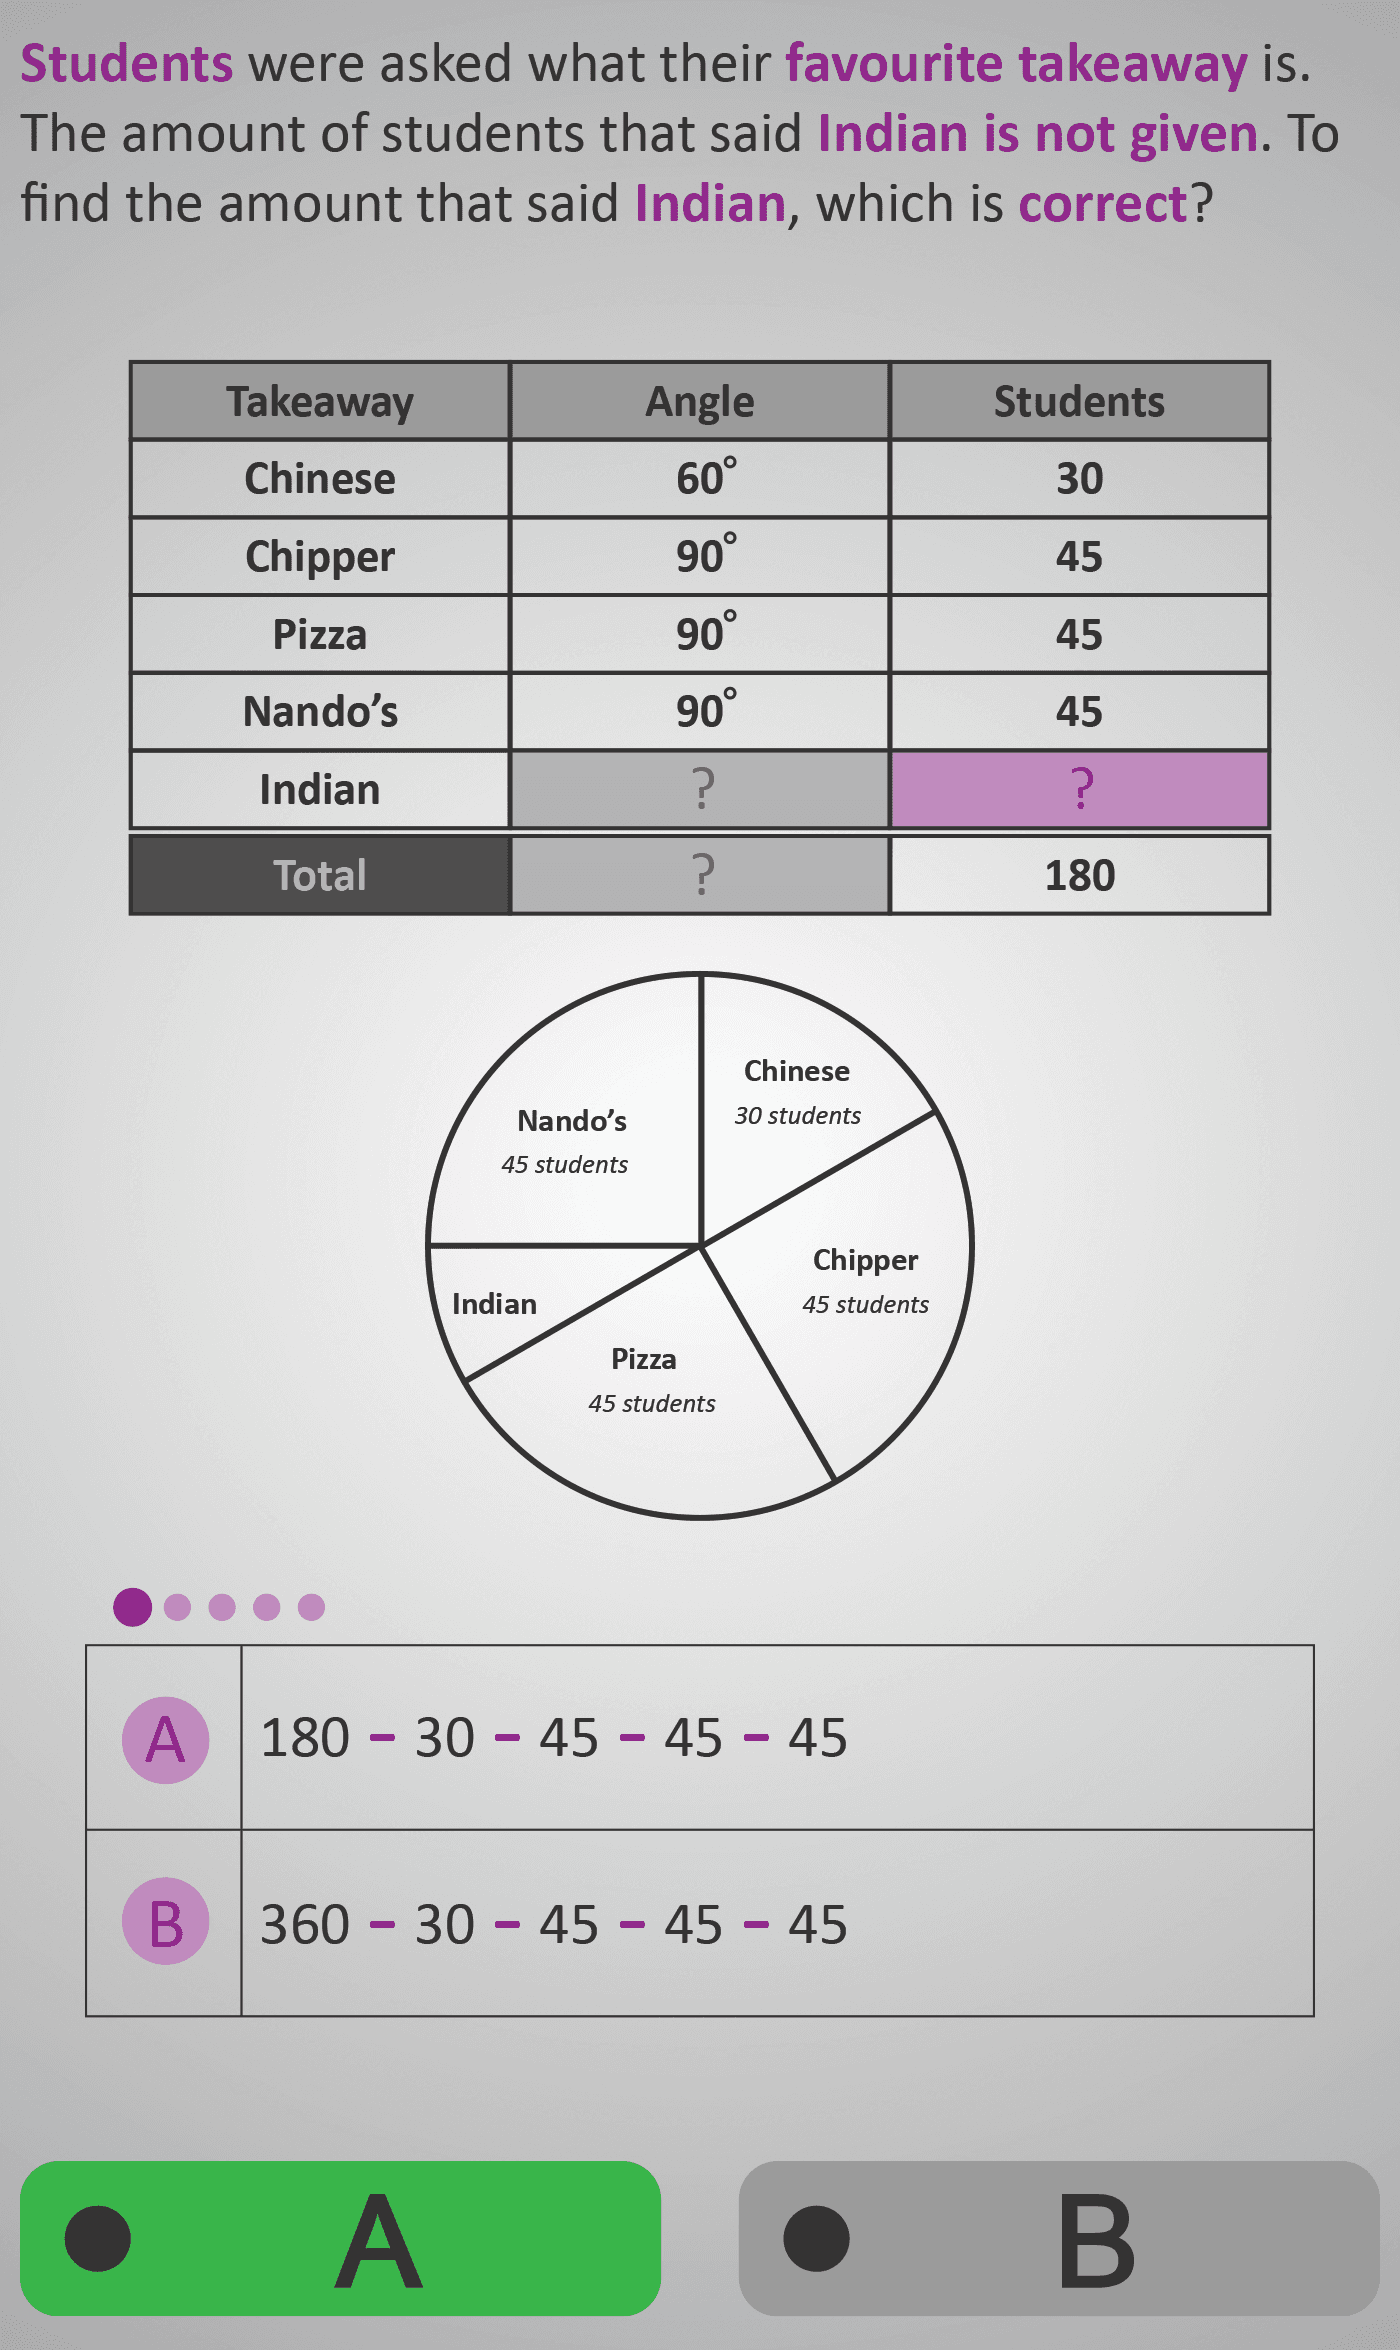
In this Phlow, learners explore pie charts where the total number of students or items differs from 360°. Using a “favourite takeaway” dataset, they calculate missing values and angles by linking totals, fractions, and proportional reasoning.
The activity begins with straightforward subtraction to find the missing category (“Indian”) and progresses to converting between the number of students and the corresponding angle on a 360° circle. Later screens introduce multi-step reasoning — verifying totals and comparing sectors to identify the most popular takeaway.
Each question connects arithmetic operations (addition, subtraction, ratio) to visual reasoning through tables and pie charts, deepening understanding of how part–whole relationships drive data visualisation.
Worked Example
      Total students = 180

      Pizza: 60 students
      Chinese: 50 students
      Indian: ?
      Burger: 40 students

      Step 1: Find missing value
      180 – (60 + 50 + 40) = 30 students

      Step 2: Convert to angle
      (30 / 180) × 360° = 60°

      Step 3: Verify total degrees
      120 + 100 + 80 + 60 = 360°

      Step 4: Identify most popular
      Pizza (60 students) → largest angle.
Sample Prompts
- How many students chose Indian as their favourite takeaway?
- What angle does 30 students represent?
- Which category is most popular overall?
- What is the total number of degrees in the chart?
Why This Matters
Pie charts appear in everyday media, reports, and surveys. By working with totals other than 360°, learners develop flexibility in reasoning and gain confidence interpreting real datasets that don’t fit neat round numbers. The familiar takeaway context ensures that the learning stays engaging and relevant.
Prerequisite Knowledge Required
- Recognise that a full circle measures 360°.
- Calculate missing totals and angles by subtraction.
- Understand proportional relationships between quantities.
- Read and interpret data tables and pie charts.
Linked Phlows:
Pie Chart 4A – Calculating Angles from Values,
Pie Chart 4B – Finding Missing Angles and Totals,
Fractions 3D – Part–Whole Relationships.
Main Category
Data & Statistics
Estimated Completion Time
Approx. 10–14 seconds per question.
40 questions total → Total time: 7–10 minutes.
Cognitive Load / Step Size
Moderate. Each stage builds directly from prior Phlows — from subtraction to proportionality to synthesis. The new twist (a total of 180 instead of 360°) introduces novelty while remaining cognitively manageable through strong visuals and consistent structure.
Language & Literacy Demand
Moderate. Clear phrasing and highlighted key terms support understanding. The familiar “takeaway” theme grounds abstract reasoning, reducing language barriers and improving engagement.
Clarity & Design
- Tables and pie charts are precisely aligned for cross-referencing.
- Missing or target values are colour-highlighted for attention.
- Consistent structure across screens maintains predictability.
- Realistic categories (Pizza, Chinese, Indian, etc.) increase relatability.
Curriculum Alignment (ROI Junior Cycle Mathematics)
- Strand: Data and Chance
- Learning Outcomes: Construct and interpret pie charts; relate proportions, angles, and totals in data representations; apply proportional reasoning to real-world problems.
Engagement & Motivation
The relatable “favourite takeaway” scenario sparks curiosity and enjoyment. Students see mathematics applied to everyday decision-making, strengthening both understanding and motivation. Gradual increases in challenge ensure continuous flow and satisfaction.
Error Opportunities & Misconceptions
- Using 360 instead of 180 as the total value.
- Mixing up quantities and angles.
- Assuming equal angles always mean equal numbers.
- Minor subtraction or rounding errors when calculating totals.
Transferability / Real-World Anchoring
Highly transferable. The reasoning applies directly to interpreting budgets, surveys, and percentage breakdowns. Learners gain confidence moving between numeric tables and circular visualisations.
Conceptual vs Procedural Balance
Balanced. Conceptually, students understand why subtraction reveals missing data. Procedurally, they practise accurate arithmetic and calculator-based proportional reasoning. Both are integrated seamlessly throughout the activity.
Learning Objectives Addressed
- Determine missing values and angles using totals less than 360°.
- Apply part–whole reasoning across numerical and graphical data.
- Link subtraction, proportion, and angular reasoning effectively.
- Interpret real-world data sets with accuracy and efficiency.
What Your Score Says About You
- Less than 20: You can read data but need more practice connecting angles and quantities.
- 21–29: You’re developing fluency with proportions but may make small arithmetic slips.
- 31–39: You can confidently solve proportional data problems.
- 40 / 40: Excellent — you fully understand how totals, angles, and values interact in pie charts.