Pie Chart 4D
Overview
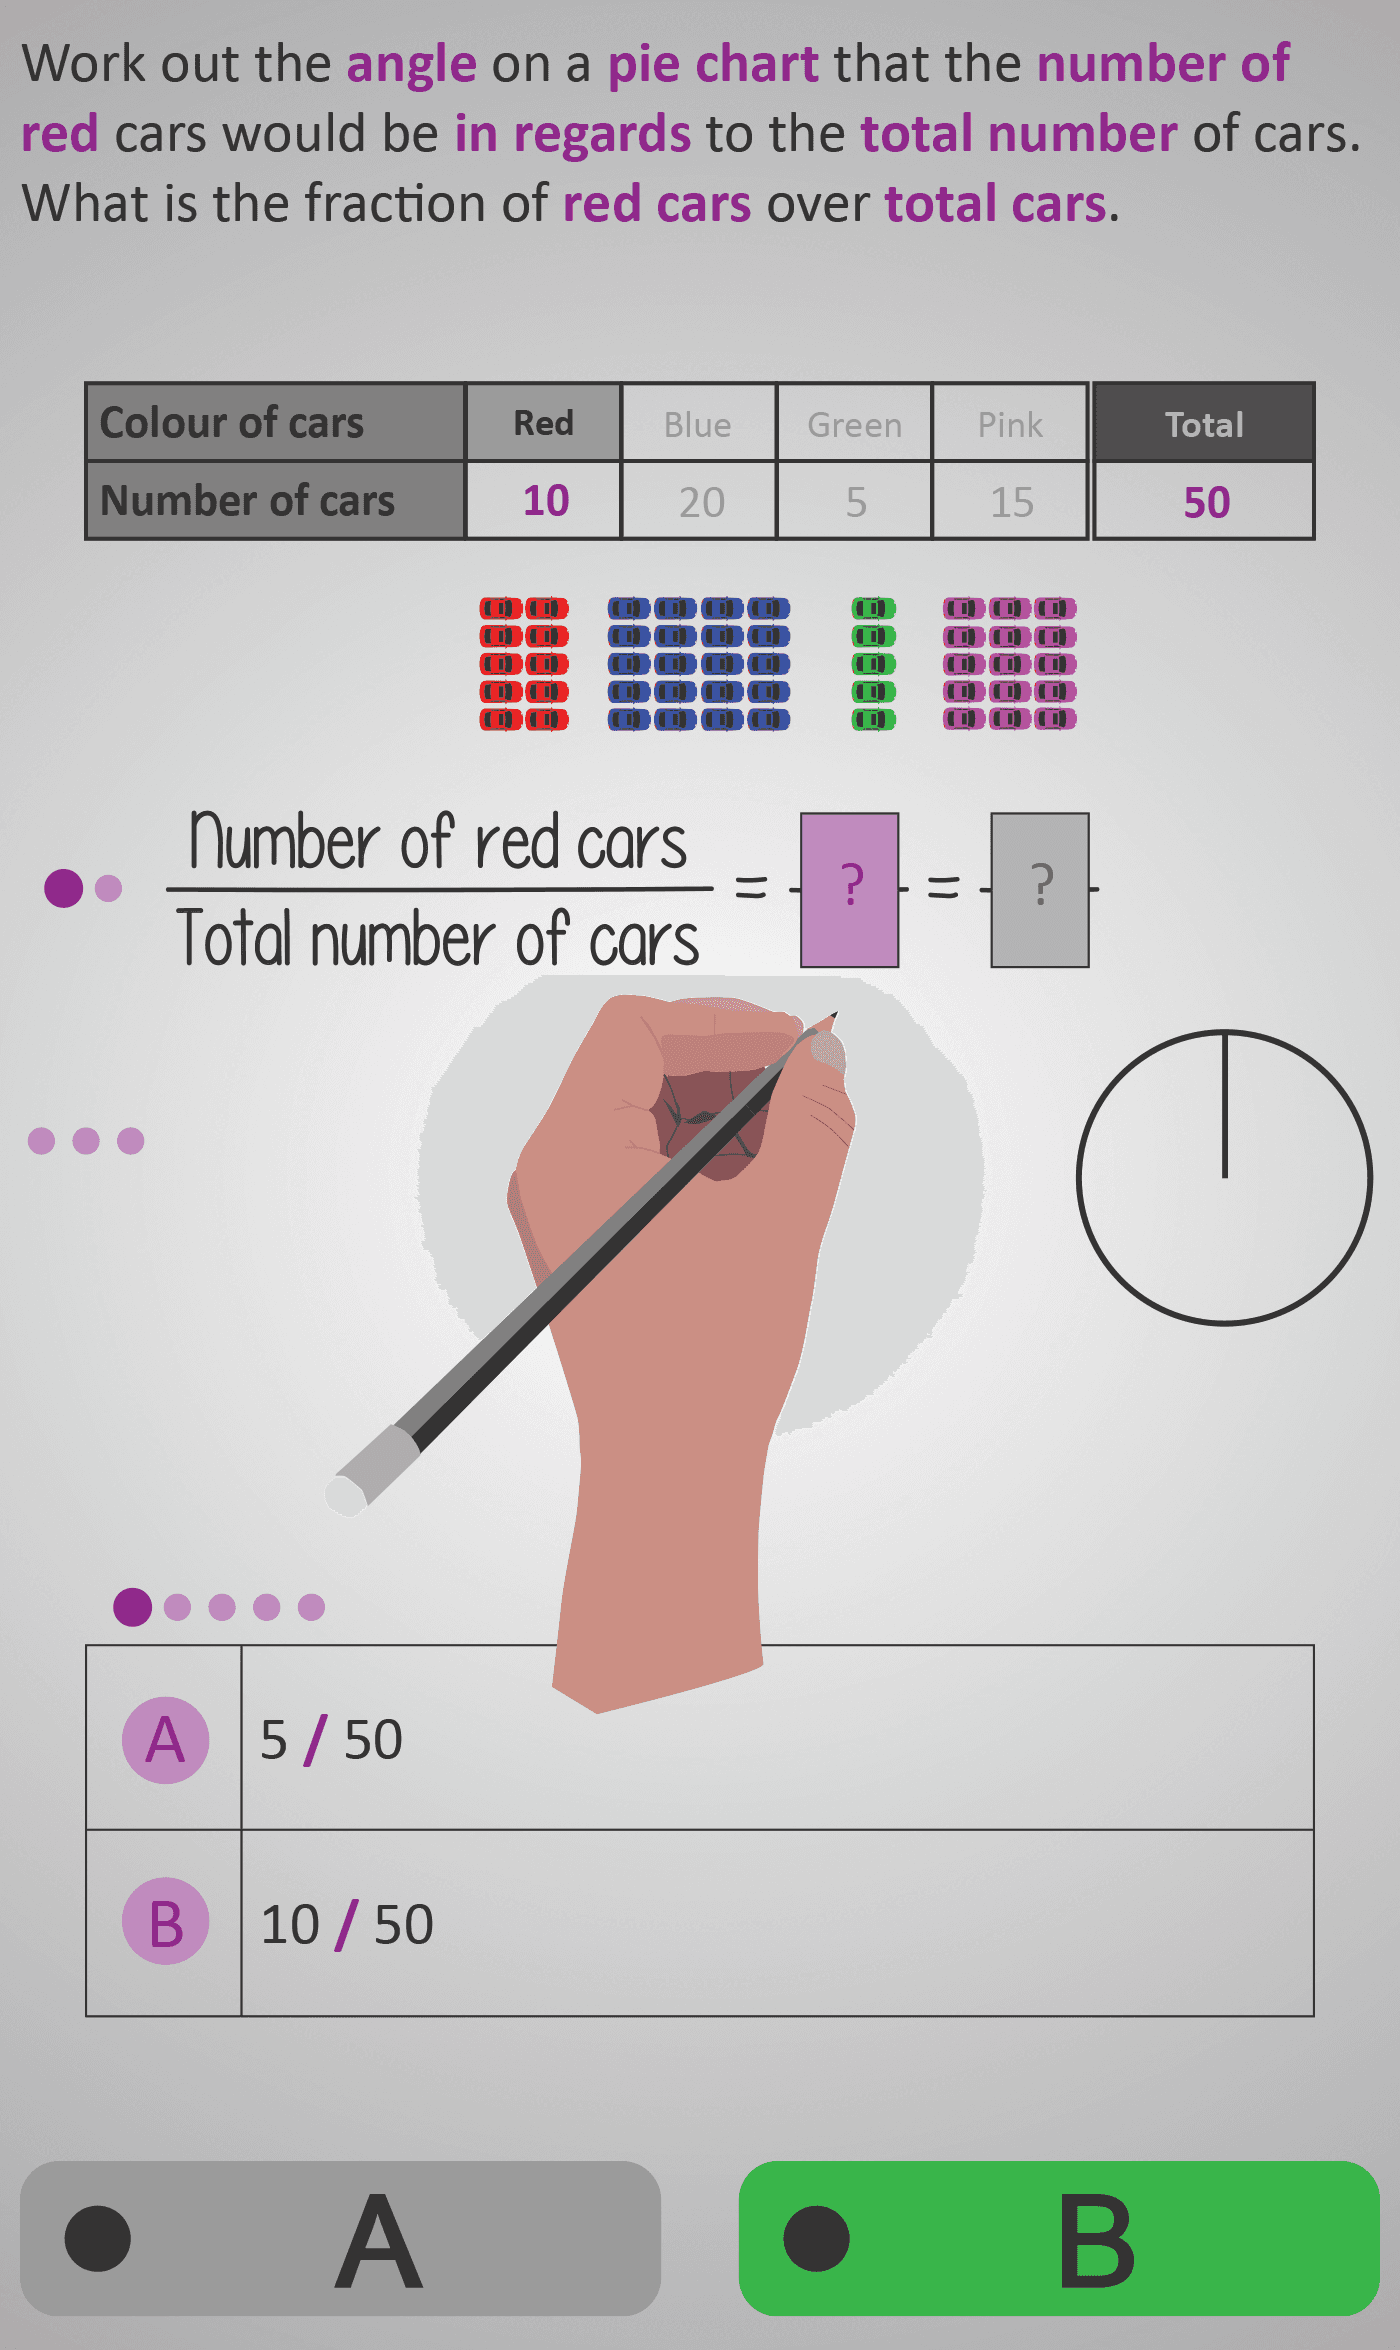
In this Phlow, learners discover how to transform data into pie chart angles by connecting fractions to degrees. Using a simple and engaging dataset about car colours, students begin by expressing each category as a part–whole fraction (e.g., 10 out of 50 = 1/5).
They then multiply this fraction by 360° to calculate the corresponding sector angle:
1/5 × 360° = 72°The process demonstrates how a circle’s total degrees can be shared proportionally according to each data category’s fraction of the total.
Each screen isolates a single reasoning step:
- Write the part–whole fraction.
- Simplify where possible.
- Multiply by 360° to find the sector angle.
- Interpret what the angle represents visually.
Worked Example
      Total cars = 50
      Red cars = 10
      Fraction = 10/50 = 1/5
      1/5 × 360° = 72°

      Therefore, the red segment = 72°.
Sample Prompts
- What fraction of all cars are red?
- How do you convert 1/5 into an angle?
- What angle represents the blue cars?
- Which colour takes up the largest sector?
Why This Matters
Understanding how fractions translate into angles is the foundation of all pie-chart reasoning. This Phlow bridges arithmetic and geometry, showing how data, proportion, and visual representation connect to form meaningful interpretations of real-world information.
Prerequisite Knowledge Required
- Recognise that a full circle equals 360°.
- Understand fractions as part–whole relationships.
- Be able to simplify fractions and multiply them by whole numbers.
- Interpret numerical data presented in tables.
Linked Phlows:
Pie Chart 4B – Interpreting and Comparing Angles,
Pie Chart 4C – Applying Proportion and Subtraction Logic,
Fractions 3E – Simplifying and Multiplying Fractions.
Main Category
Data & Statistics
Estimated Completion Time
Approx. 10–14 seconds per question.
40 questions total → Total time: 7–10 minutes.
Cognitive Load / Step Size
Low to moderate. Each question isolates one micro-step in the reasoning chain, preventing overload and allowing focused mastery of the fraction–angle connection. Progression follows a clear logic: setup → simplification → multiplication → interpretation.
Language & Literacy Demand
Low. The mathematical reasoning is primarily numerical and visual. Instructions are concise, with colour highlighting drawing attention to key operations. This design supports accessibility for all literacy levels.
Clarity & Design
- Colour-coded car icons align with each data category.
- Equations build step-by-step for clarity.
- Consistent purple highlights indicate the active operation.
- Each screen visually connects the fraction, operation, and resulting angle.
Curriculum Alignment (ROI Junior Cycle Mathematics)
- Strand: Data and Chance
- Learning Outcomes: Represent data using pie charts; calculate sector sizes from proportions; apply fractions to interpret relationships between parts and wholes.
Engagement & Motivation
The use of coloured cars and dynamic visuals keeps the task engaging and familiar. Students experience satisfaction as fractions transform smoothly into accurate pie chart sectors, reinforcing a sense of logical mastery and discovery.
Error Opportunities & Misconceptions
- Forgetting that a full circle = 360°, not 100°.
- Mixing up numerator and denominator in the part/whole fraction.
- Incorrectly multiplying or dividing during the fraction step.
- Assuming raw numbers correspond directly to angle size without using proportion.
Transferability / Real-World Anchoring
Highly transferable. Learners can apply this process to any dataset that needs proportional representation — such as budgets, survey responses, or time-use analysis — strengthening real-world data literacy.
Conceptual vs Procedural Balance
Balanced. Conceptual insight (a fraction of a circle) comes first, followed by procedural fluency (multiplying by 360°). Visual models reinforce meaning before formal calculation.
Learning Objectives Addressed
- Express data as fractions of a total.
- Multiply fractions to find corresponding sector angles.
- Connect proportional reasoning to circular representations.
- Convert real-world data into accurate graphical form.
What Your Score Says About You
- Less than 20: You can identify data but need more fluency with fractions and multiplication.
- 21–29: You understand the concept but may misapply the fraction process.
- 31–39: You confidently calculate angles from data using fractions.
- 40 / 40: Excellent — you can derive and explain how fractions, proportions, and angles connect perfectly.