Plot a Graph 4
Overview
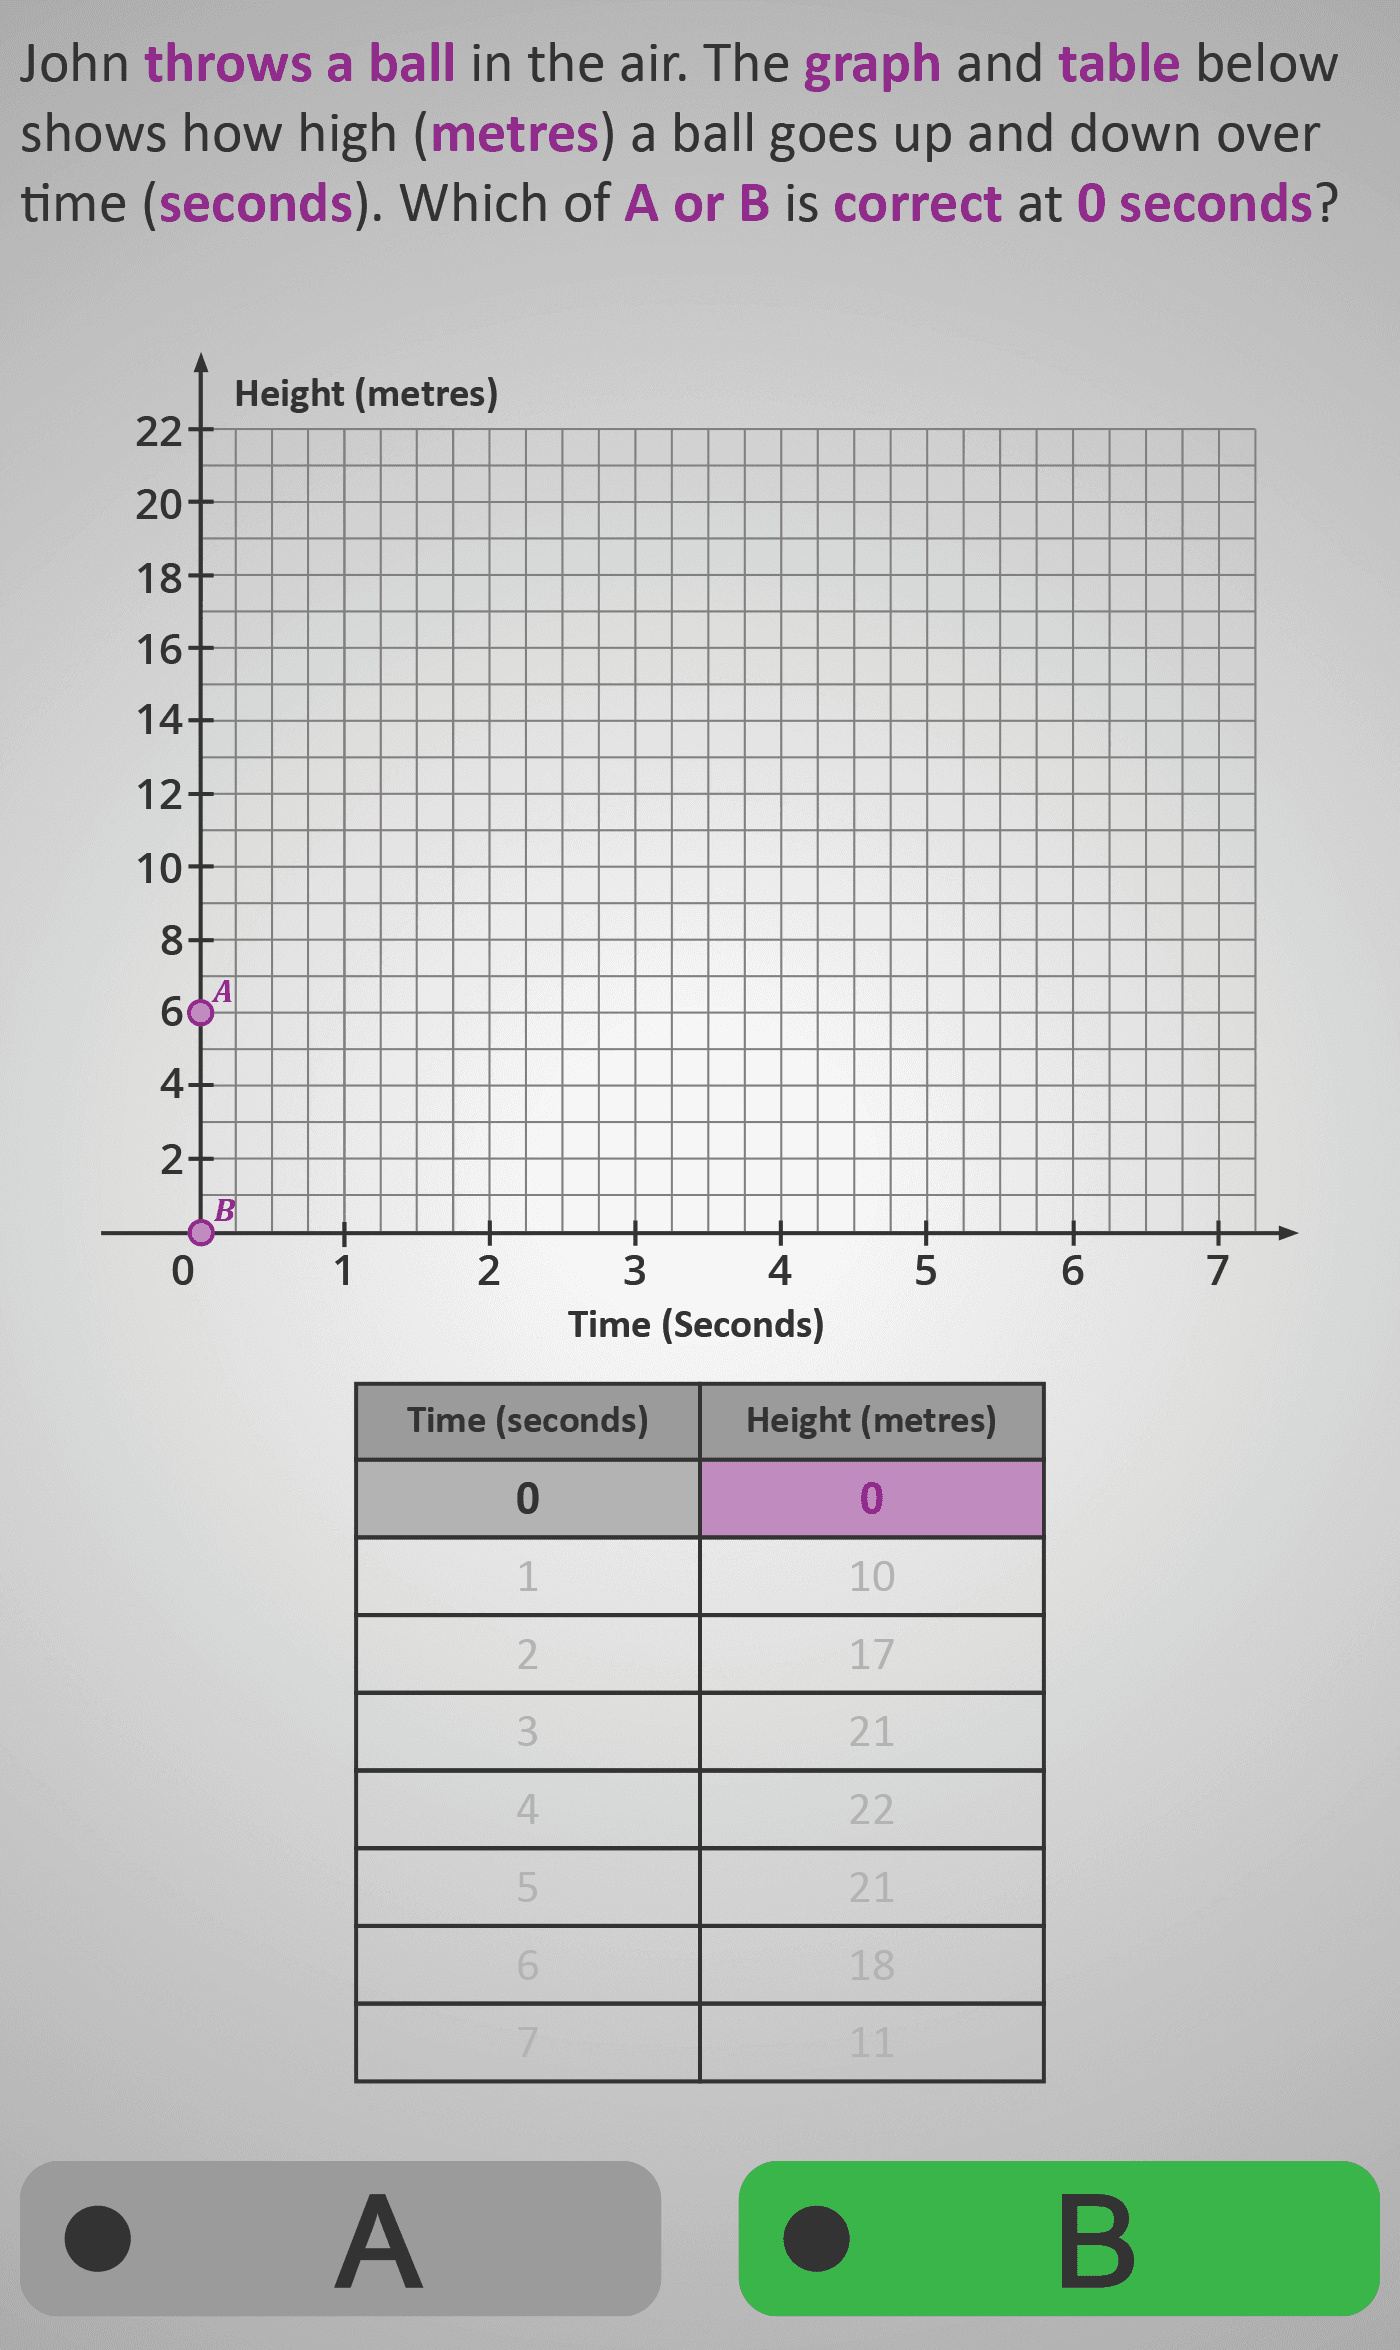
In this Phlow, learners explore how motion can be represented graphically. Using the real-world scenario of a ball being thrown upwards and returning to the ground, students connect time and height data from a table to points on a coordinate grid.
Each question introduces a single moment (from 0–7 seconds) and asks learners to select which plotted point (A or B) correctly represents that data. As points are revealed sequentially, the parabolic shape of the ball’s flight emerges. This visual progression helps students understand how graphs show change — not just static pictures.
The activity bridges tables, coordinates, and curved graphs, providing the foundation for later study of motion, algebraic functions, and non-linear relationships.
Worked Example
      Time (s)   Height (m)
      0          0
      1          5
      2          9
      3          12
      4          9
      5          5
      6          0

      Step 1: Highlight the time = 3s in the table.
      Step 2: Find height = 12m.
      Step 3: Locate coordinate (3, 12) on the graph.
      Step 4: Choose which point (A or B) matches this location.
Sample Prompts
- Which of A or B shows the correct point at 3 seconds?
- What happens to the height after 4 seconds?
- At what time does the ball reach its maximum height?
- Which section of the graph shows the ball falling back down?
Why This Matters
Understanding graphs as stories of change is a key skill across mathematics and science. By linking data points to real motion, learners develop intuitive insight into relationships between variables — an essential foundation for algebra, physics, and statistics.
Prerequisite Knowledge Required
- Know how to read and plot coordinates (x, y) on a graph.
- Understand that the x-axis and y-axis represent different variables.
- Recognise that graphs can show change over time.
- Have experience interpreting simple straight-line graphs.
Linked Phlows:
Graphs 3A–3C – Reading and Plotting Points,
Tables 3F – Connecting Number Patterns to Graphs.
Main Category
Data & Graphs
Estimated Completion Time
Approx. 10–14 seconds per question.
40 questions total → Total time: 7–10 minutes.
Cognitive Load / Step Size
Moderate. Each screen introduces only one coordinate pair, reducing working memory demands. Learners focus on matching a single value before noticing the curve’s overall shape. The smooth parabolic sequence ensures continuity and supports comprehension.
Language & Literacy Demand
Low to moderate. Repeated phrasing (“Which of A or B is correct at … seconds?”) provides structure and familiarity. Mathematical vocabulary (graph, table, metres, seconds) is consistently supported by visuals.
Clarity & Design
- Clear graph–table layout for side-by-side reasoning.
- Purple highlight connects table row to graph coordinate.
- Consistent A/B choice format reinforces comparison and accuracy.
- Parabolic curve revealed gradually for visual understanding of motion.
Curriculum Alignment (ROI Junior Cycle Mathematics)
- Strands: Data and Chance; Functions
- Learning Outcomes: Interpret and plot data from tables; recognise patterns using graphical forms; connect variables to visualise relationships.
Engagement & Motivation
The physical context of a thrown ball is instantly relatable and engaging. Learners visualise height over time, connecting movement to mathematics. This “story graph” format sustains interest and strengthens intuitive understanding of variables.
Error Opportunities & Misconceptions
- Mixing up x (time) and y (height) axes.
- Counting grid squares incorrectly.
- Assuming all graphs must be straight lines.
- Confusing rise and fall due to symmetrical shape.
Transferability / Real-World Anchoring
Strong. Skills extend naturally to physics, sports analysis, and any context involving change over time — such as distance–time graphs or growth curves. Learners develop graph literacy for interpreting dynamic systems.
Conceptual vs Procedural Balance
Balanced. The procedural task (identifying coordinates) builds fluency, while the conceptual layer (seeing a pattern of change) deepens understanding of how graphs tell real-world stories.
Learning Objectives Addressed
- Read and interpret coordinates on a graph.
- Connect numerical tables to graphical representation.
- Recognise and describe parabolic motion patterns.
- Develop fluency and confidence in matching data to visual form.
What Your Score Says About You
- Less than 20: You can read individual values but may mix up axes or positions.
- 21–29: You plot most points correctly but may misjudge scale or alignment.
- 31–39: You accurately match values and understand how the graph represents motion.
- 40 / 40: Excellent — you can interpret, reason from, and describe graphs fluently, ready for more complex functions.