Probability 4A
Overview
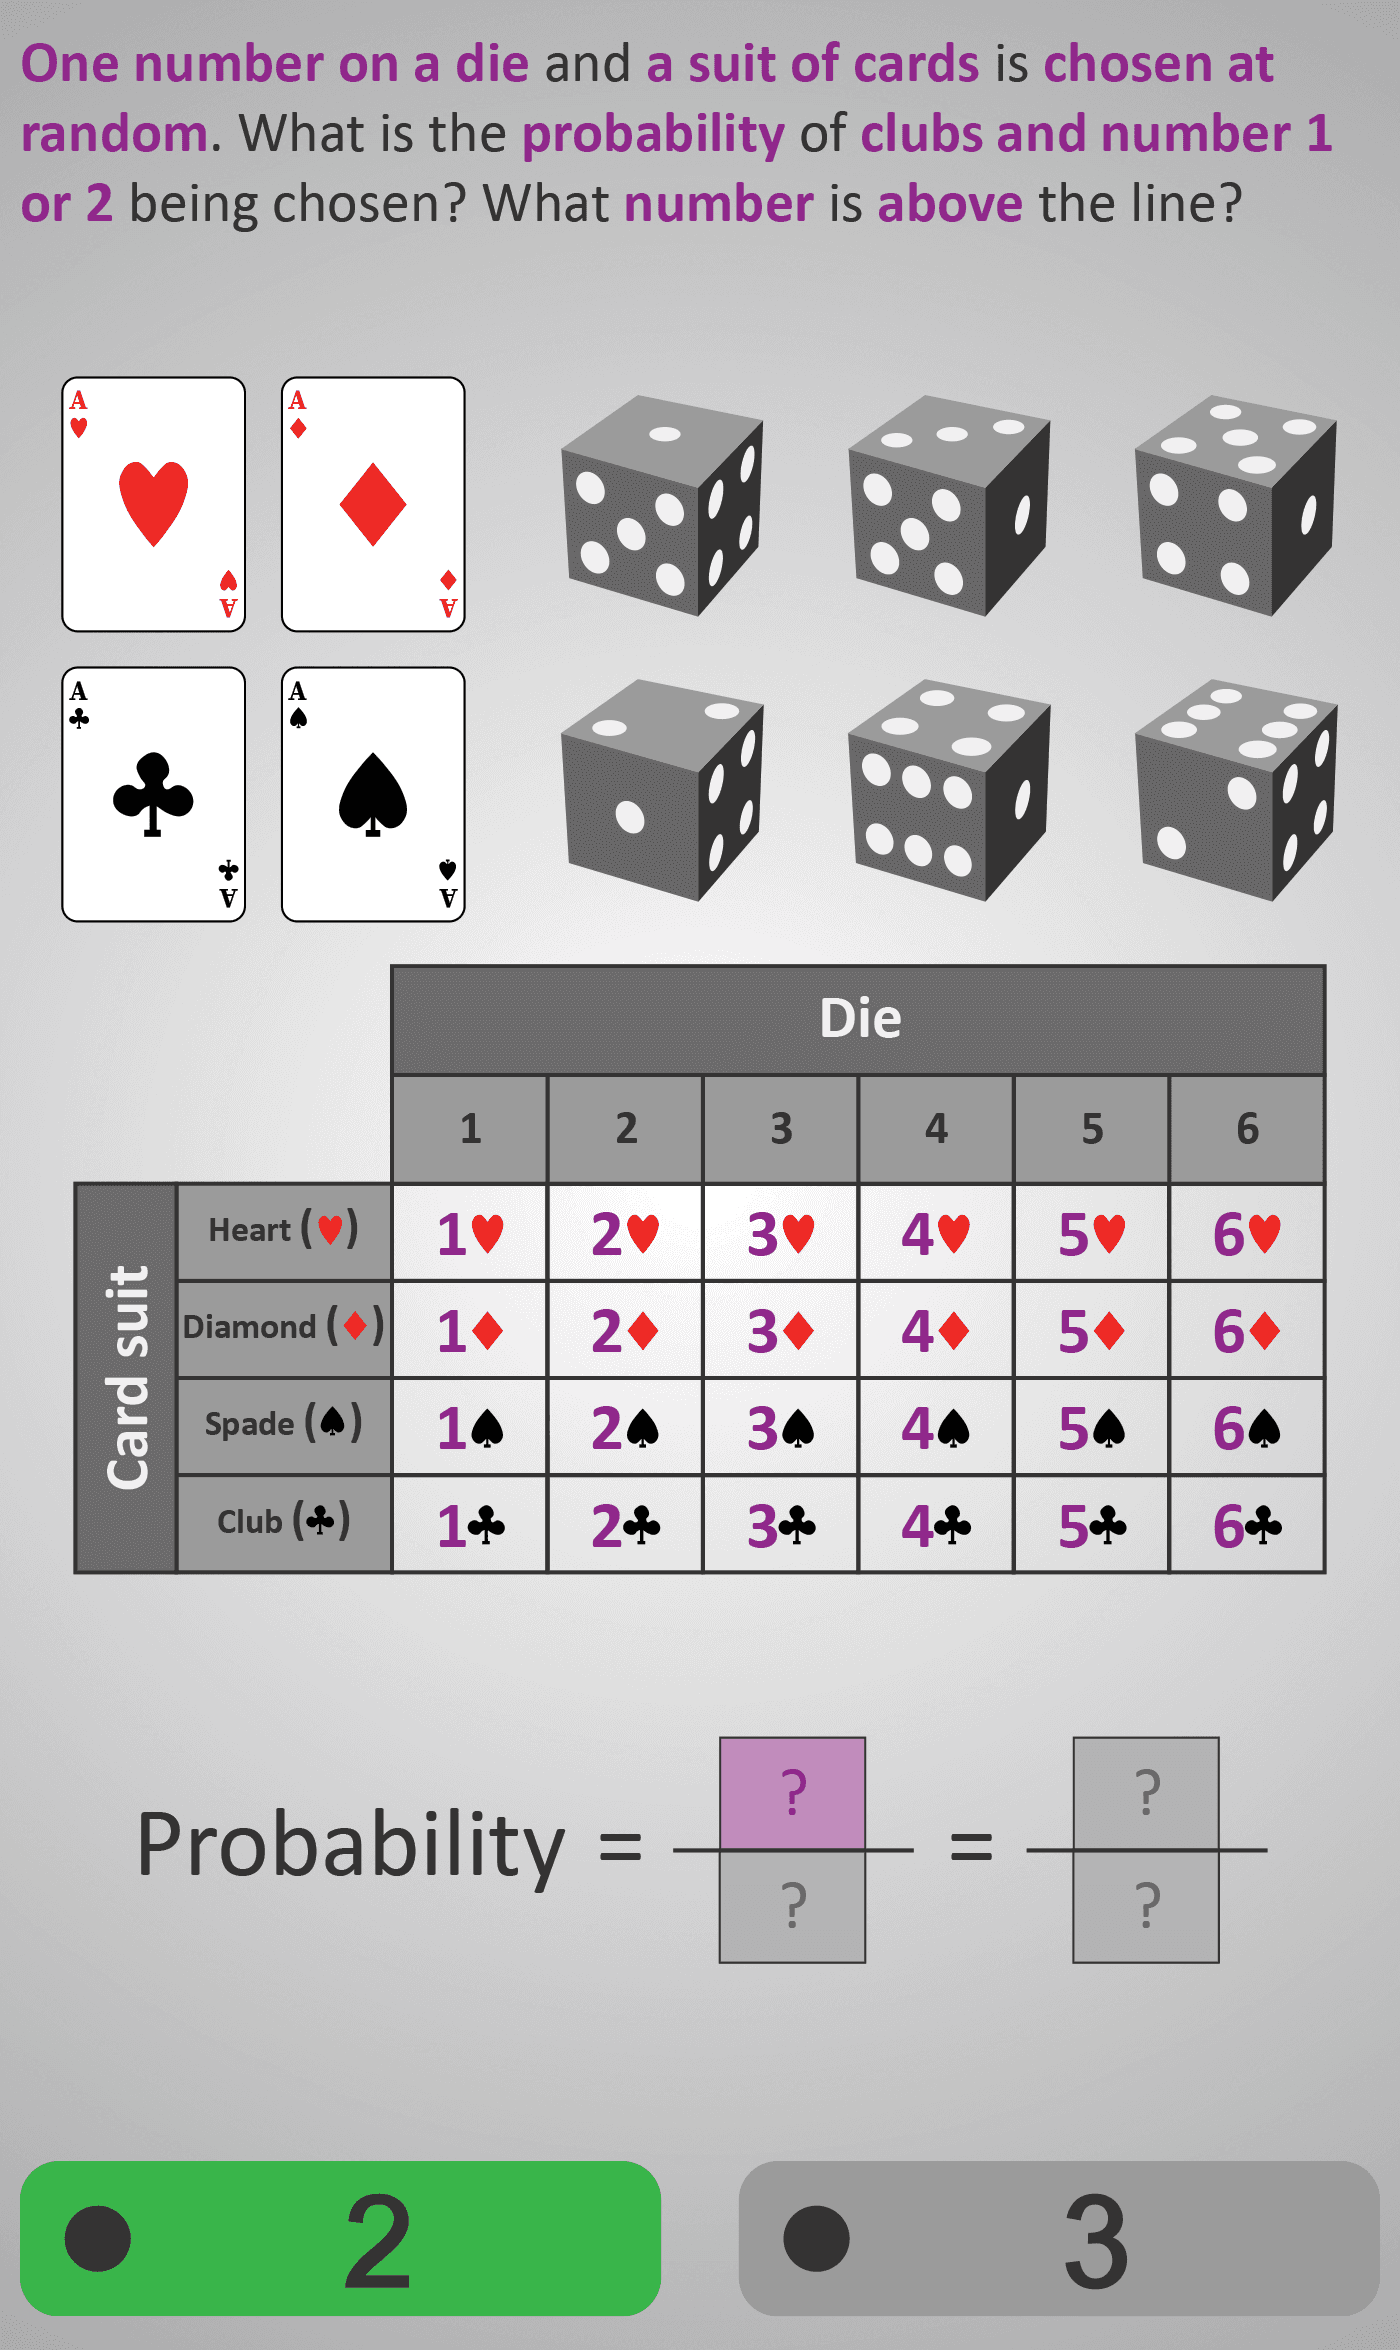
In this Phlow, learners calculate probabilities using a die (1–6) and card suits (♥ ♦ ♣ ♠) as two combined random events. They interpret a 4×6 grid showing all 24 possible outcomes, then identify the number of favourable results and express this as a fraction of the total.
The activity guides students through the full reasoning process:
- Identify the favourable outcomes (e.g., clubs showing 1 or 2 → 2 outcomes).
- Recognise the total possible outcomes (4 suits × 6 numbers = 24).
- Write the probability as a fraction (2/24).
- Simplify to its lowest terms (1/12).
This visual and structured approach builds procedural fluency and conceptual understanding: learners see that probability = favourable ÷ total outcomes.
Worked Example
Total suits = 4
Total numbers = 6
Total outcomes = 4 × 6 = 24

Favourable outcomes = 2 (clubs and numbers 1 or 2)
Probability = 2 / 24 = 1 / 12
Sample Prompts
- How many total outcomes are shown in the grid?
- Which outcomes show hearts with an even number?
- What fraction represents this probability?
- Can you simplify it to its lowest terms?
Why This Matters
Probability connects counting, fractions, and fairness. By visualising every possible result, learners develop deep understanding of chance as “what you want over what can happen.” This Phlow links earlier counting logic to formal probability reasoning.
Prerequisite Knowledge Required
- Understand fractions and how to simplify them.
- Recognise sample spaces and systematic listing of outcomes.
- Know that probability = favourable outcomes ÷ total outcomes.
Linked Phlows:
Possible Choices 4D – Reading Two-Variable Outcome Grids,
Fractions 3E – Simplifying Ratios and Parts of a Whole.
Main Category
Probability & Fractions
Estimated Completion Time
Approx. 10–14 seconds per question.
40 questions total → Total time: 7–10 minutes.
Cognitive Load / Step Size
Moderate. Learners combine two ideas — counting and fractions — but the grid scaffolds thinking visually. The clear 4×6 table ensures reasoning remains manageable and repeatable.
Language & Literacy Demand
Low. Sentences are short and consistent, with key terms highlighted (e.g., probability, numerator, denominator). Visuals carry meaning so reading ability does not limit understanding.
Clarity & Design
- Colour-coding separates suits (red, black, purple highlights).
- Probability fraction appears directly below the grid.
- Repeated die and card imagery maintains familiarity.
- Step-by-step visual reveal connects counting to probability calculation.
Curriculum Alignment (ROI Junior Cycle Mathematics)
- Strand: Data and Chance
- Learning Outcomes: Represent combined outcomes using tables; determine probability as fractions; simplify to lowest form; interpret probability as favourable ÷ total outcomes.
Engagement & Motivation
The use of dice and cards feels playful and authentic. Students experience how real games connect to mathematical logic. Visual feedback during simplification reinforces progress and success.
Error Opportunities & Misconceptions
- Swapping numerator and denominator.
- Forgetting to count all outcomes (not multiplying 4×6).
- Incorrect simplification (e.g., halving only one value).
- Misreading suit or number from the table.
Transferability / Real-World Anchoring
High. This reasoning transfers to any context involving chance — games, experiments, and everyday risk. It forms the foundation for sample spaces, tree diagrams, and later probability percentages.
Conceptual vs Procedural Balance
Balanced. Procedure: count → fraction → simplify. Concept: understand why probability represents “what you want over what can happen.” The visual grid bridges theory and calculation.
Learning Objectives Addressed
- Identify total and favourable outcomes from two events.
- Express probabilities as fractions and simplify them.
- Visualise outcome spaces in grid form.
- Develop intuitive understanding of chance and fairness.
What Your Score Says About You
- Less than 20: You can count outcomes but need practice ordering fractions correctly.
- 21–29: You find favourable outcomes but sometimes simplify incorrectly.
- 31–39: You confidently form and simplify probability fractions.
- 40 / 40: Excellent — you fully understand probability as fair comparison between outcomes.