Probability 4C
Overview
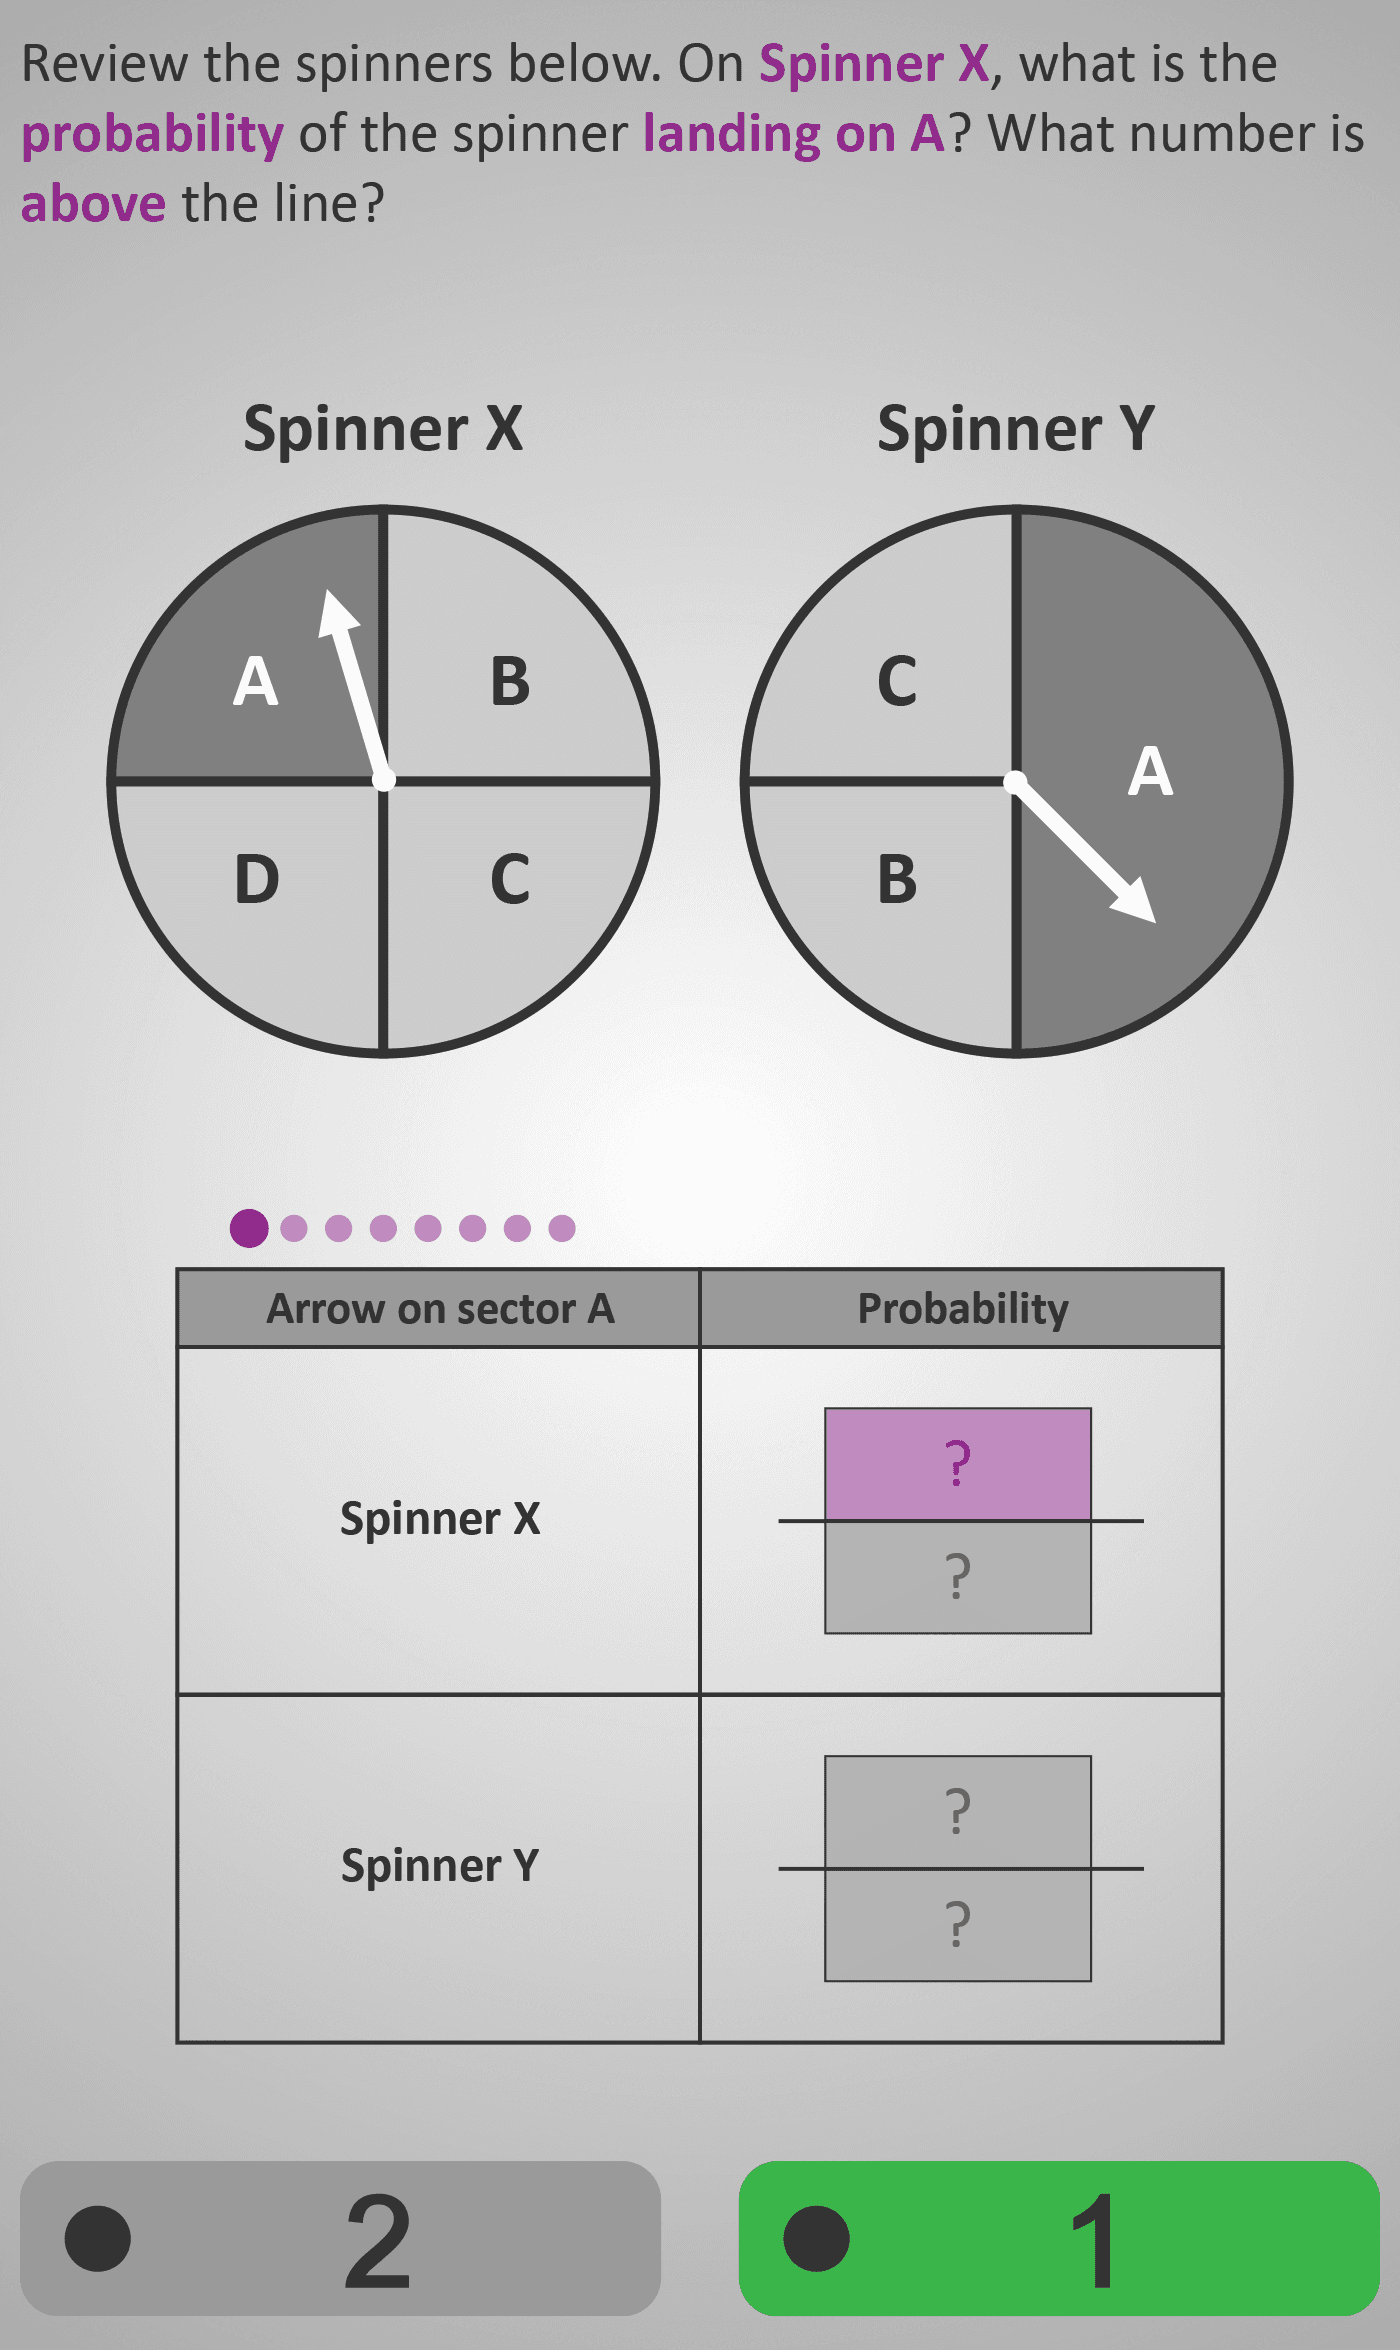
In this Phlow, learners compare probabilities using two side-by-side spinners — Spinner X and Spinner Y — each divided into labelled segments (A, B, C, D) of different sizes. Students identify the chance of landing on a given sector (e.g., “A”) for each spinner, record the probability as a fraction, simplify it, and determine which spinner offers the higher likelihood.
The activity develops proportional reasoning by linking visual size and numerical probability. Learners see how more space on the spinner represents a greater chance of landing on that outcome.
Worked Example
Spinner X: 4 equal sectors (A, B, C, D)
Spinner Y: 12 sectors (6 labelled A)

P(A on X) = 1/4
P(A on Y) = 6/12 = 1/2

Comparison → Spinner Y gives a higher chance of landing on A.
Step sequence:
- Identify the number of favourable outcomes (numerator).
- Identify total outcomes (denominator).
- Form and simplify the probability fraction.
- Compare which spinner has greater likelihood.
Sample Prompts
- How many times does A appear on each spinner?
- What fraction represents each probability?
- Which spinner gives a higher chance of landing on A?
- Why is one more likely than the other?
Why This Matters
This Phlow builds understanding that probability comparisons rely on relative proportions, not just counts. By connecting fractions to visual models, learners develop strong intuition for fairness, ratios, and likelihood — essential skills for advanced probability reasoning.
Prerequisite Knowledge Required
- Know that probability = favourable outcomes ÷ total outcomes.
- Understand how to simplify fractions.
- Be familiar with comparative terms: more likely, less likely, equal chance.
Linked Phlows:
Probability 4A – Probability as a Fraction of Total Outcomes,
Probability 4B – Qualitative Likelihood Terms.
Main Category
Probability & Fractions
Estimated Completion Time
Approx. 10–14 seconds per question.
40 questions total → Total time: 7–10 minutes.
Cognitive Load / Step Size
Moderate. Each question builds incrementally: identify → form → simplify → compare. The visual pairing of spinners stabilises attention and reinforces conceptual links between size and likelihood.
Language & Literacy Demand
Low to moderate. Prompts are short and repetitive (“Which spinner is more likely?”). Mathematical vocabulary (probability, simplify, sector) is supported visually through spinner diagrams and step labels.
Clarity & Design
- Two large, side-by-side spinners enable immediate comparison.
- Tables below link sectors to fractional probabilities.
- Purple highlights show numerator and denominator focus points.
- Minimal design ensures attention stays on reasoning, not decoration.
Curriculum Alignment (ROI Junior Cycle Mathematics)
- Strand: Data and Chance
- Learning Outcomes: Determine probability as a fraction of total outcomes; compare probabilities between events; simplify and interpret fractions; explain likelihood using visual and numeric evidence.
Engagement & Motivation
Comparing two spinners feels like a challenge — learners predict and verify which spinner is “fairer” or “more likely.” This interactive setup encourages curiosity and competition.
Error Opportunities & Misconceptions
- Reversing numerator and denominator.
- Forgetting to simplify fractions fully.
- Assuming equal sectors mean equal chances without checking proportions.
- Comparing by addition instead of proportion.
Transferability / Real-World Anchoring
High. Concepts apply to comparing biased games, data fairness, and visual ratios — connecting maths to real decision-making and everyday risk evaluation.
Conceptual vs Procedural Balance
Balanced. Procedural fluency (forming and simplifying fractions) is reinforced through conceptual reasoning about segment size and fairness.
Learning Objectives Addressed
- Express probability as a fraction and simplify it.
- Compare probabilities across two visual models.
- Link segment size to numerical probability.
- Use reasoning to explain “more likely” and “less likely.”
What Your Score Says About You
- Less than 20: You’re connecting fractions to probability but need more practice linking visuals to numbers.
- 21–29: You identify probabilities correctly but sometimes skip simplification or comparison.
- 31–39: You simplify and compare accurately, showing clear probability reasoning.
- 40 / 40: Excellent — you understand fractional probability and fairness conceptually and procedurally.