Probability 4D
Overview
In this Phlow, learners shift from visual models (spinners/dice) to
categorical lists such as colours, shapes, cereals, and school subjects.
For each question, they identify favourable outcomes, count the total outcomes,
and write the probability as a fraction: favourable ÷ total.
Later items extend to combined groups and simple “or” events.
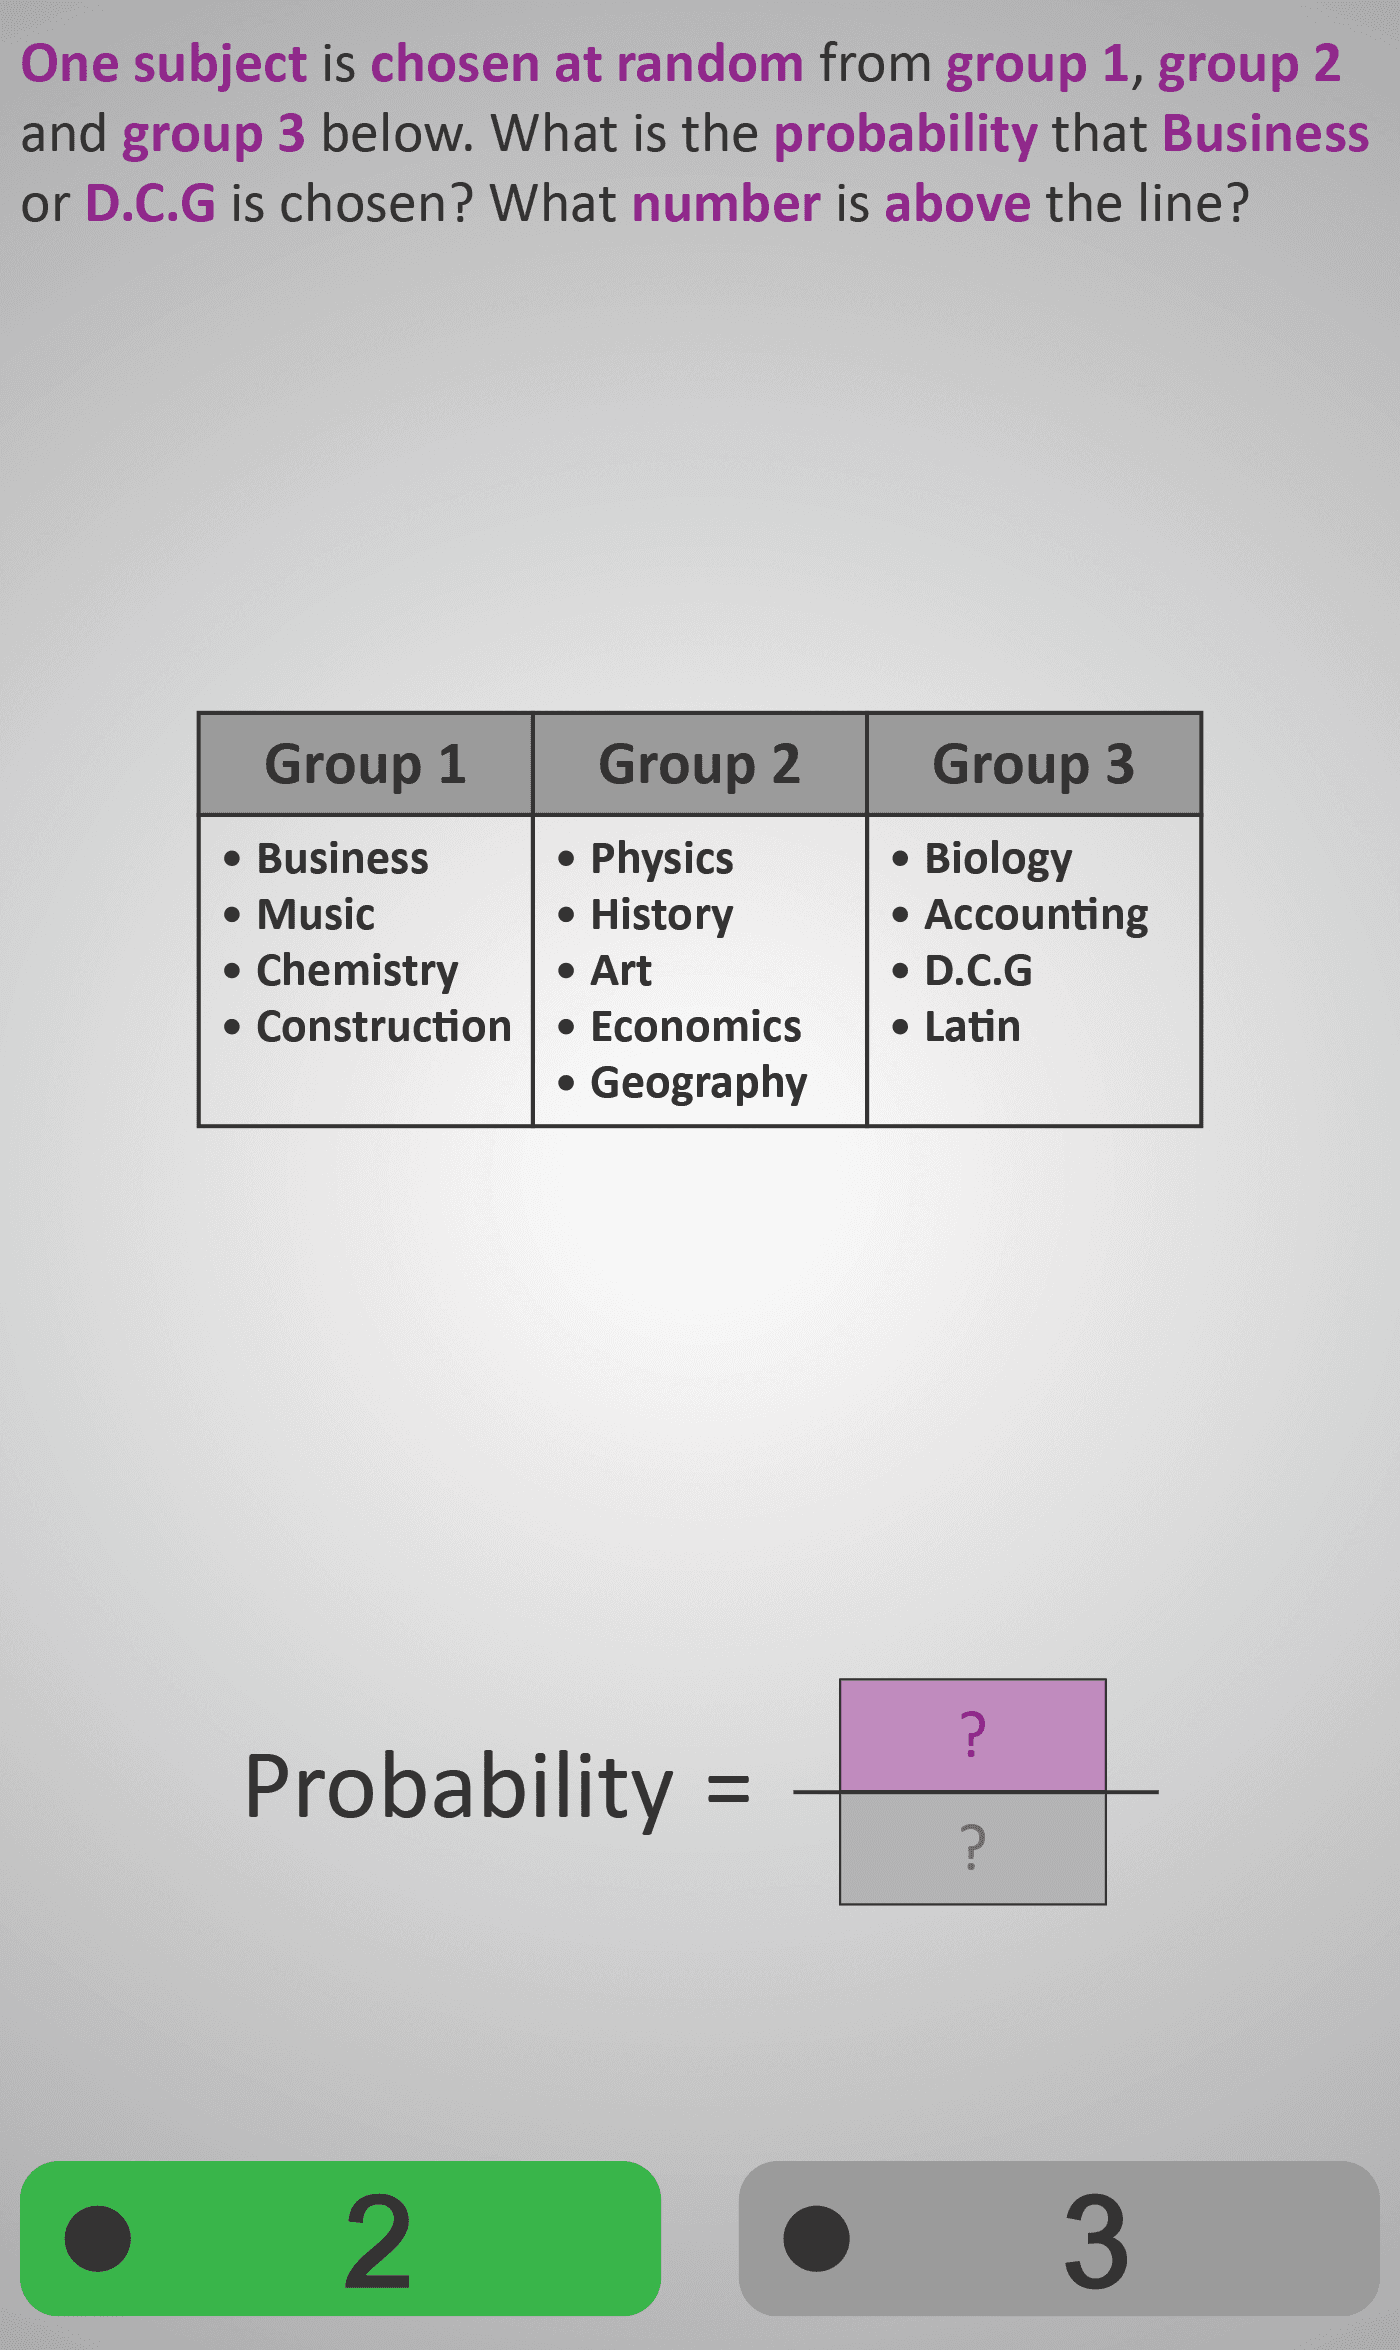
Worked Example
Group 3 (Cereals): { Coco Pops, Corn Flakes, Weetabix, Cheerios, Rice Krispies }

Q: Probability of choosing Coco Pops or Weetabix at random?

Favourable outcomes = 2  (Coco Pops, Weetabix)
Total outcomes      = 5
Probability         = 2 / 5
Step sequence:
- Read the group(s) and highlight the target item(s).
- Count favourable outcomes.
- Count total outcomes in the relevant group(s).
- Write the fraction and, if needed, simplify.
Sample Prompts
- How many items match the condition?
- How many total options are there?
- What goes above the line? What goes below?
- For “A or B”, how do the favourable counts combine?
Why This Matters
Most real-world probability starts with lists and categories, not diagrams. This Phlow connects everyday selections to formal probability language, strengthening the habit of structuring chance as a clear fraction.
Prerequisite Knowledge Required
- Know that probability = number of favourable outcomes ÷ total outcomes.
- Accurate counting and awareness of duplicates.
- Interpret short word problems, including the use of “or”.
Linked Phlows:
Probability 4B – Qualitative Likelihoods,
Probability 4C – Fractions with Visual Models.
Main Category
Probability & Data
Estimated Completion Time
Approx. 10–14 seconds per question.
40 questions total → Total time: 7–10 minutes.
Cognitive Load / Step Size
Moderate (slightly higher than visual models). Reasoning steps are simple, but information now comes from text. The addition of “or” introduces a mild conceptual extension, supported by the fraction scaffold.
Language & Literacy Demand
Moderate. Everyday contexts (foods, subjects) with phrases like “chosen at random” and “probability that … or …”. Repetition of terms (favourable, random, chosen) strengthens mathematical literacy.
Clarity & Design
- Three-column group tables are evenly spaced and scannable.
- Purple highlight cues “above/below the line” for numerator/denominator.
- Clean layout foregrounds counting and fraction setup, avoiding decorative clutter.
Curriculum Alignment (ROI Junior Cycle Mathematics)
- Strand: Data and Chance
- Learning Outcomes: Express probabilities of simple events as fractions; recognise probabilities between 0 and 1; determine probabilities for “either/or” events using counting; compare events with different totals.
Engagement & Motivation
Relatable categories (cereals, subjects) connect maths to daily choices. Varied lists maintain interest while practising the same core reasoning pattern.
Error Opportunities & Misconceptions
- Miscounting totals when groups combine.
- Swapping numerator and denominator.
- Treating “or” as multiplication instead of adding favourable counts.
- Reading from the wrong group when multiple are shown.
Transferability / Real-World Anchoring
Strong. Skills apply to surveys, games, experiments, and later topics like two-step events and sample spaces.
Conceptual vs Procedural Balance
Primarily procedural on a clear concept. Repeated fraction setup automates the process, while “above = what we want” and “below = all possibilities” preserves conceptual meaning.
Learning Objectives Addressed
- Identify favourable outcomes from lists or grouped categories.
- Write and interpret probabilities as fractions.
- Combine simple events with “or”.
- Strengthen fraction understanding in real contexts.
What Your Score Says About You
- Less than 20: Building the link between counting and probability — focus on favourable vs total.
- 21–29: Solid with single groups; still consolidating multi-group “or” reasoning.
- 31–39: Confident across varied contexts; applies “or” logic and fractions accurately.
- 40 / 40: Fluent with categorical probability; ready for compound/dependent events.