Probability 4E
Overview
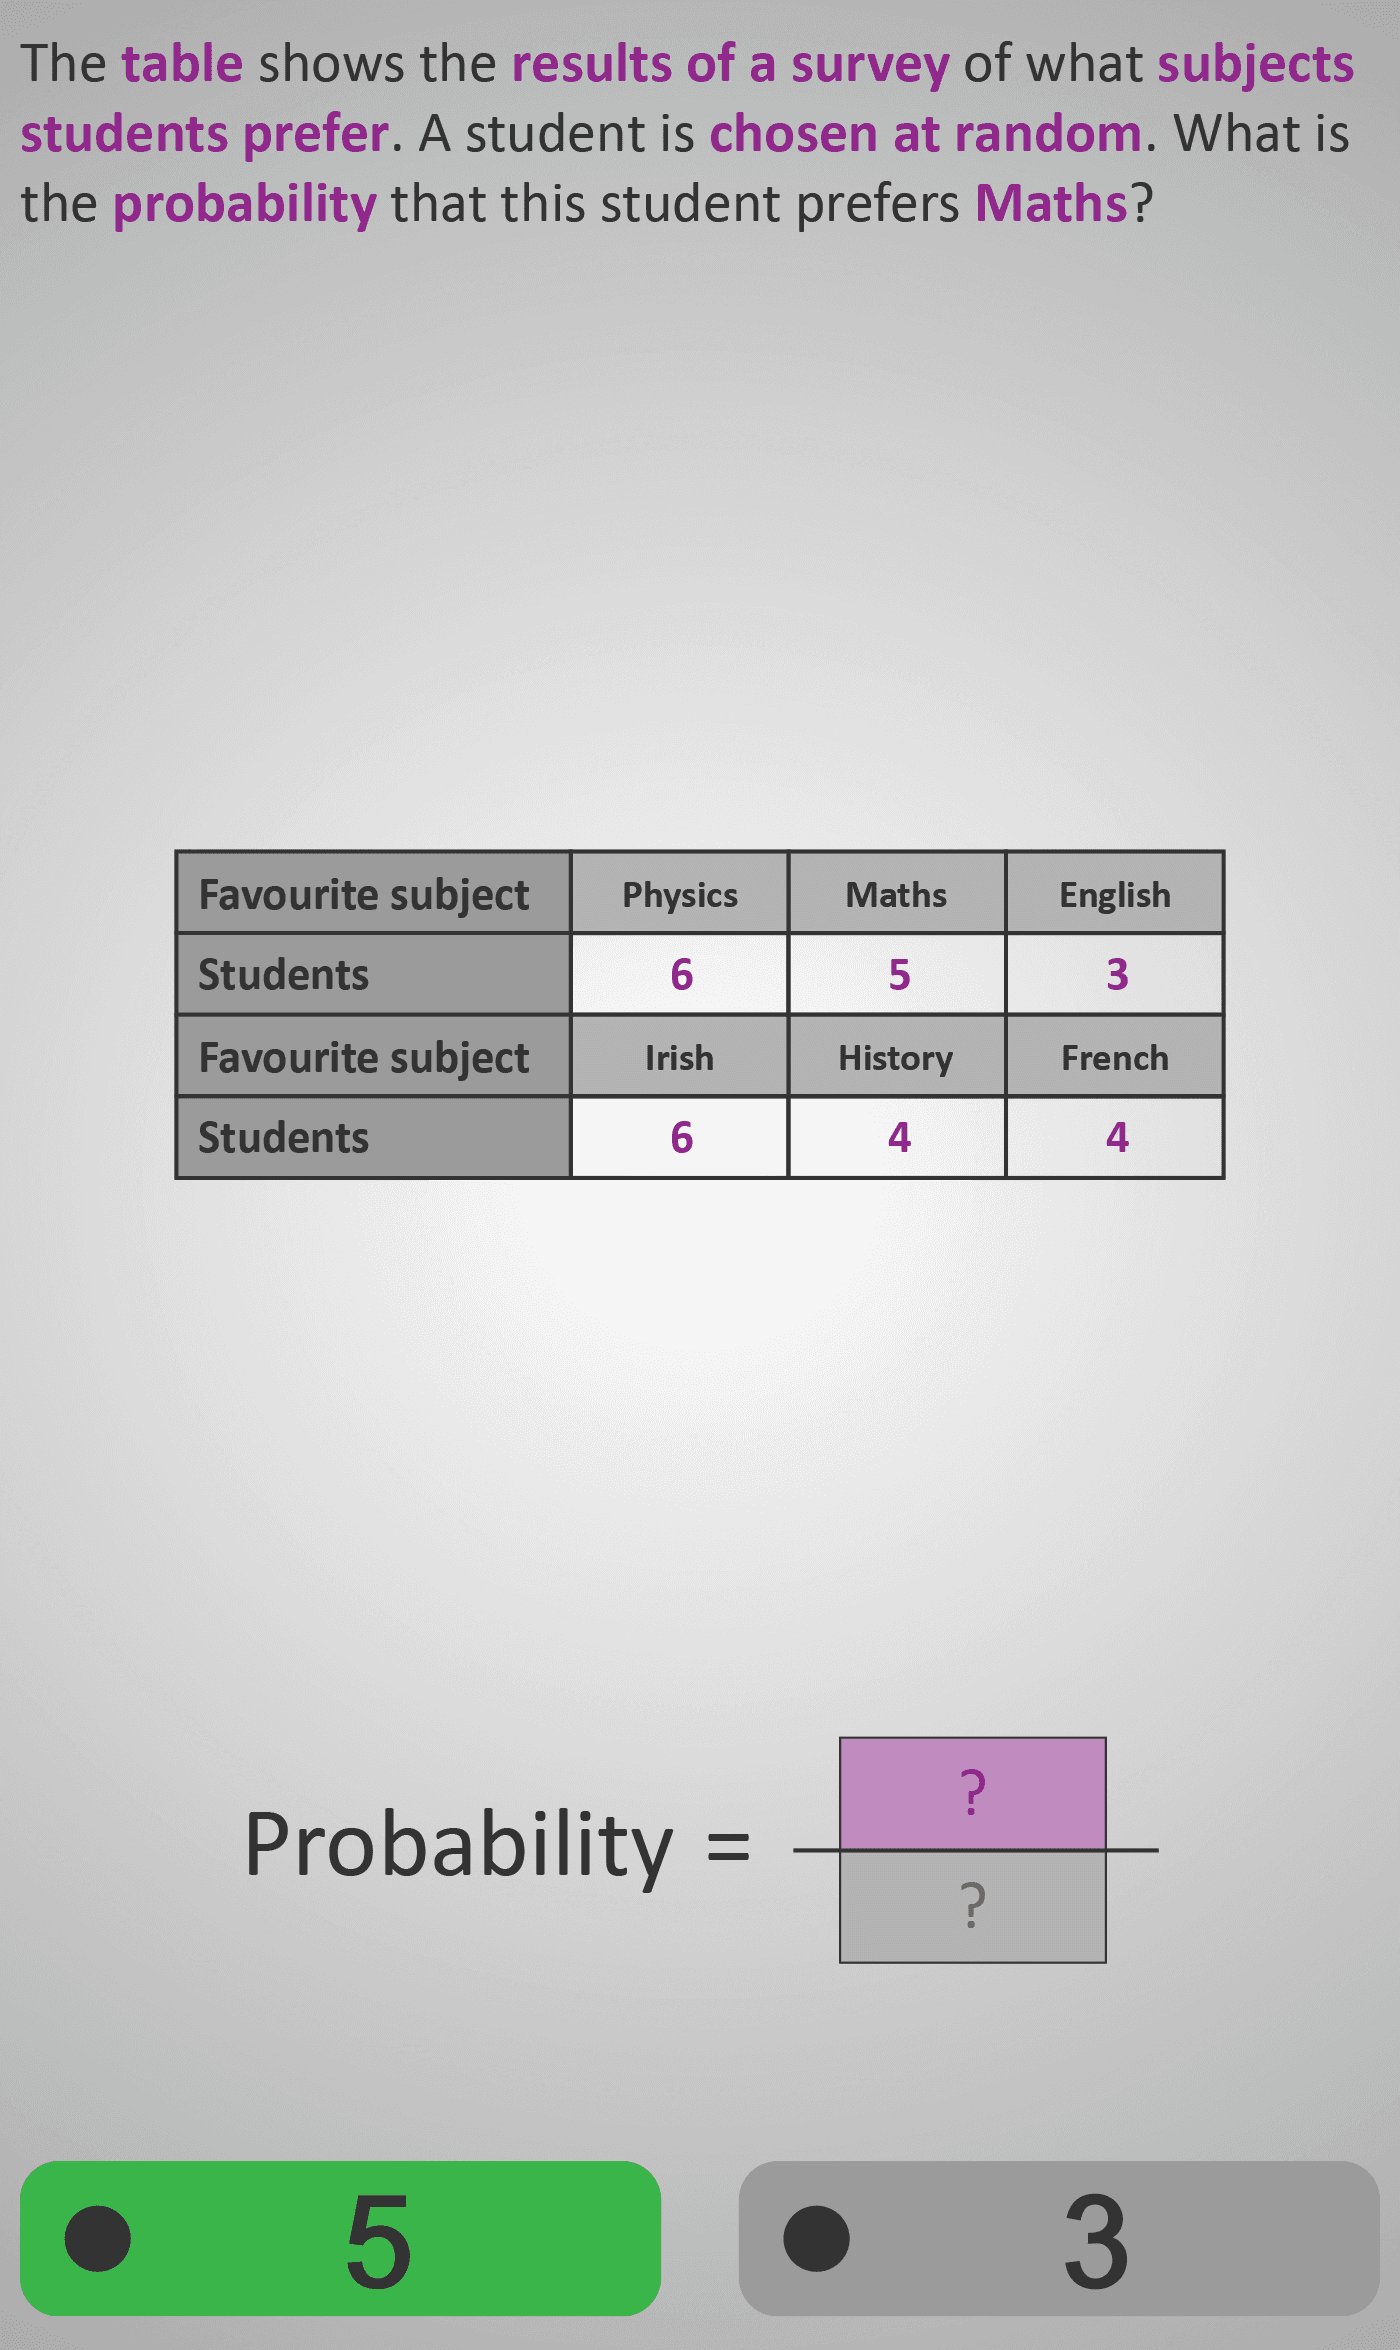
In this Phlow, learners calculate probabilities using data tables that show frequencies from real-world surveys or scenarios (e.g., favourite subjects, gym weights). They determine the number of favourable outcomes and the total number of outcomes, then express the probability as a fraction.
This Phlow transitions from counting items in lists (as in Probability 4D) to reading structured tables — bridging everyday data interpretation and formal probability reasoning.
Worked Example
Survey of favourite subjects:
Maths   | 6
Science | 8
English | 4
Art     | 2
Total   | 20

Q: Probability that a student chosen at random studies Science.
→ Favourable = 8
→ Total = 20
→ Probability = 8 / 20 = 2 / 5
Step sequence:
- Locate the relevant category and its frequency.
- Find the total frequency (sum of all categories).
- Write the probability fraction
favourable ÷ total. - Simplify and interpret the result.
Sample Prompts
- What is the total number of results in the table?
- How many belong to the chosen category?
- What goes above and below the line in the fraction?
- What is the probability in simplest form?
Why This Matters
Reading data tables is a key life skill. This Phlow helps learners connect data interpretation to probability reasoning, showing how real-world frequencies become mathematical probabilities. It prepares students for later work on bar charts, sample spaces, and statistics.
Prerequisite Knowledge Required
- Understand that probability = favourable outcomes ÷ total outcomes.
- Be able to read data tables and sum totals correctly.
- Recognise frequency as the number of occurrences.
Linked Phlows:
Probability 4C – Comparing Probabilities from Visual Models,
Probability 4D – Probability from Lists and Groups.
Main Category
Probability & Data Handling
Estimated Completion Time
Approx. 10–14 seconds per question.
40 questions total → Total time: 7–10 minutes.
Cognitive Load / Step Size
Moderate. Learners follow the familiar numerator–denominator pattern but apply it to tabular data. The consistent layout reduces cognitive effort while supporting conceptual transfer from lists to datasets.
Language & Literacy Demand
Moderate. Key mathematical terms (table, total, chosen at random, probability) are highlighted in context. Questions are short, and tables anchor comprehension visually.
Clarity & Design
- Structured grids with clear headings and consistent number formatting.
- Purple highlights guide “above/below the line” reasoning.
- Simple, realistic contexts (surveys, weights) maintain engagement without distraction.
- Consistent table design supports transfer to future data-driven Phlows.
Curriculum Alignment (ROI Junior Cycle Mathematics)
- Strand: Data and Chance
- Learning Outcomes: Identify and calculate probability from frequency data; express probabilities as fractions; distinguish between theoretical and experimental probability; interpret tabular data to describe likelihood.
Engagement & Motivation
Relatable real-world datasets (class surveys, gym weights) make the maths tangible. Each question provides visible progress through correct fraction setup and simplification.
Error Opportunities & Misconceptions
- Miscounting totals when summing frequencies.
- Confusing “number of students” with “number of categories.”
- Swapping numerator and denominator.
- Forgetting probabilities must be ≤ 1.
Transferability / Real-World Anchoring
High. Learners can apply this reasoning to surveys, polls, experiments, and frequency tables — a critical bridge between everyday data literacy and formal statistics.
Conceptual vs Procedural Balance
Balanced, leaning procedural. The repeated structure reinforces the procedure (count → total → fraction → simplify) while the real-world context preserves conceptual meaning.
Learning Objectives Addressed
- Use tables to determine the probability of events.
- Calculate total frequencies and interpret their meaning.
- Express probability as a fraction derived from frequency data.
- Compare probabilities across datasets or categories.
What Your Score Says About You
- Less than 20: Beginning to read and interpret tables — work on connecting quantities to outcomes.
- 21–29: Good with counting but may misread totals or positions.
- 31–39: Confidently extracts and applies data to calculate accurate probabilities.
- 40 / 40: Excellent — fluent in linking data and probability, ready for compound and conditional contexts.