Range 4
Overview
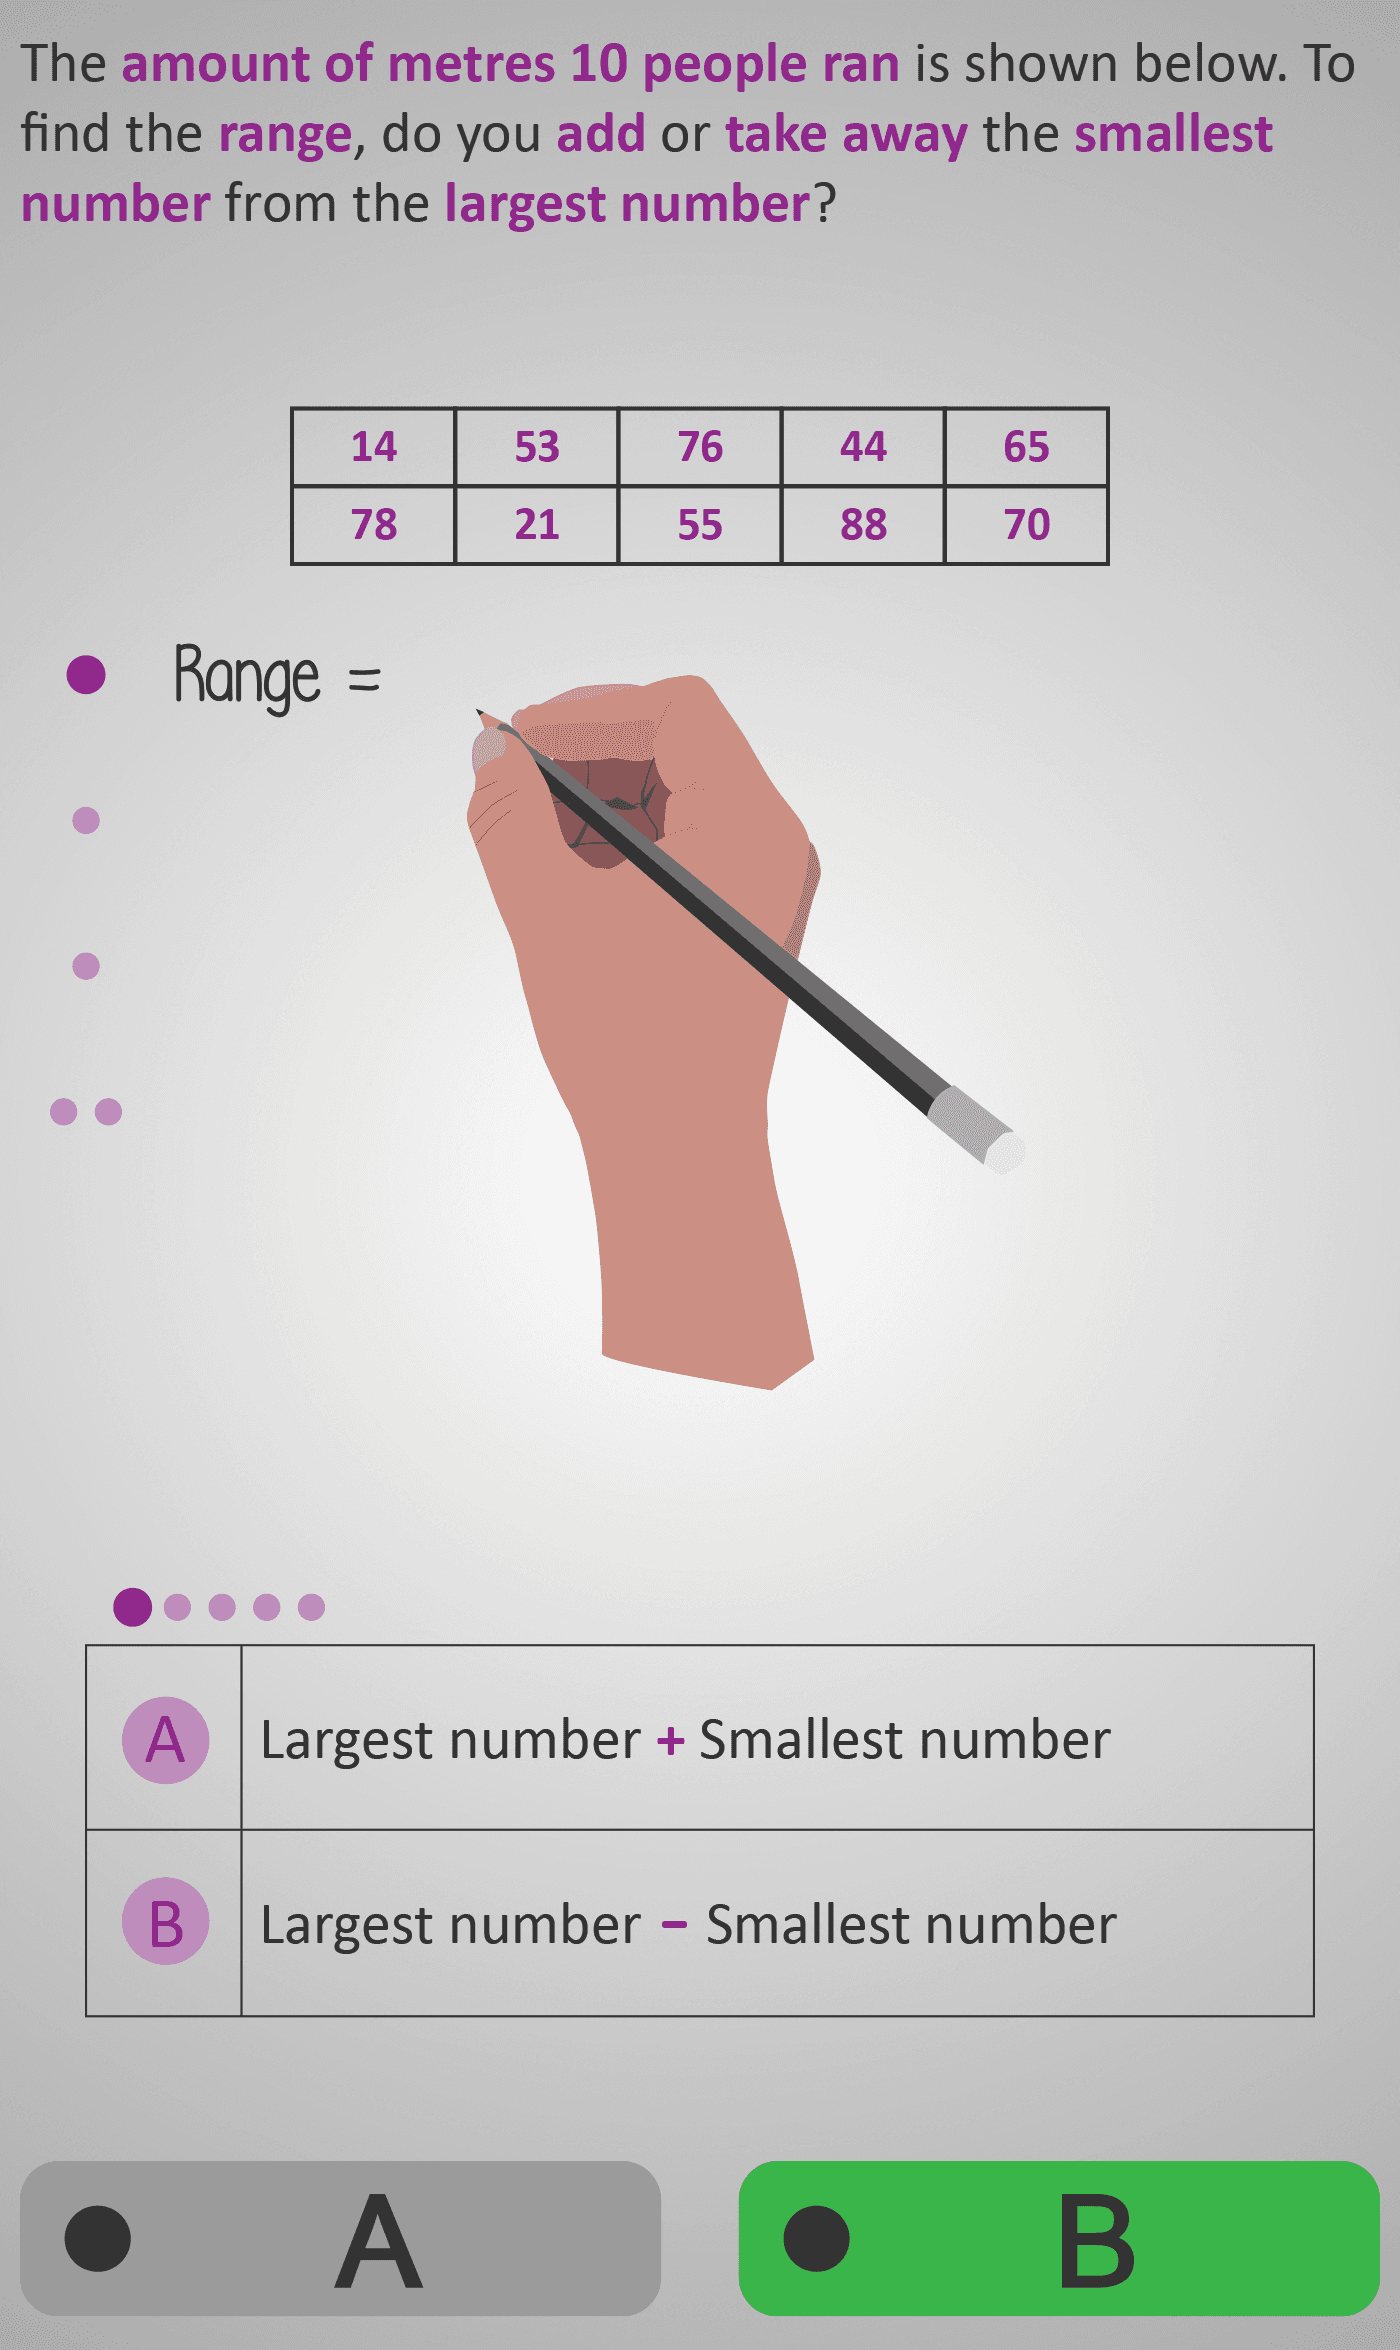
In this Phlow, learners explore the concept of range — the difference between the largest and smallest values in a dataset. Using a table of distances run by ten people, students calculate how much the data varies overall.
Each screen isolates one reasoning step: deciding whether to add or subtract, identifying the largest number, finding the smallest, and finally computing the range. This pacing ensures that students build both understanding and confidence through clear, incremental progression.
Worked Example
Distances (metres): 88, 76, 63, 59, 48, 44, 30, 22, 17, 14

Largest = 88
Smallest = 14
Range = 88 - 14 = 74 m
Step sequence:
- Recognise that range = largest − smallest.
- Locate both numbers in the table.
- Subtract carefully using written or mental calculation.
- Record and interpret the answer with units (metres).
Sample Prompts
- Should we add or take away to find the range?
- Which number in the table is the largest?
- Which number is the smallest?
- What is 88 − 14?
- What does this range tell us about the data?
Why This Matters
Understanding range helps students interpret real data and describe how much results differ. It’s a foundation for later work in statistics, data interpretation, and variation analysis. The running-distance example connects maths to everyday experiences, making abstract ideas concrete and memorable.
Prerequisite Knowledge Required
- Understand place value and basic subtraction.
- Identify the largest and smallest numbers in a list.
- Read simple data tables.
Linked Phlows:
Compare 3A – Ordering Numbers,
Subtract 3B – Finding the Difference,
Data Tables 3A – Reading Simple Tables.
Main Category
Data & Statistics – Representing and Interpreting Data
Estimated Completion Time
Approx. 10–14 seconds per question.
40 questions total → Total time: 7–10 minutes.
Cognitive Load / Step Size
Low cognitive load, well-sequenced. Each question introduces one micro-step — deciding on the operation, identifying numbers, or subtracting — ensuring full comprehension before combining steps into the final range calculation.
Language & Literacy Demand
Low to moderate. Key terms (largest, smallest, range, subtract) are repeated and visually highlighted, helping all readers. Visual supports reduce text dependency while reinforcing vocabulary.
Clarity & Design
- One consistent table shown throughout for visual stability.
- Purple highlights mark the active concept (largest, smallest, etc.).
- Handwriting-style animation shows subtraction clearly.
- Clean, minimal design keeps attention on reasoning steps.
Curriculum Alignment (ROI Junior Cycle Mathematics)
- Strand: Data
- Learning Outcomes: Identify and calculate range as a measure of spread; interpret data in tables; compare numerical values and explain variation.
Engagement & Motivation
The running-distance scenario feels real and relatable. Students enjoy discovering “how far apart” results are, gaining a concrete sense of what data spread means.
Error Opportunities & Misconceptions
- Adding instead of subtracting to find the range.
- Reversing the subtraction order (smallest − largest).
- Choosing incorrect extreme values.
- Leaving out measurement units (m).
Transferability / Real-World Anchoring
High. The concept of range transfers directly to sports, experiments, surveys, and measurement comparisons — anywhere data varies.
Conceptual vs Procedural Balance
Balanced. Learners build conceptual understanding (what range represents) and procedural fluency (how to calculate it) through guided progression.
Learning Objectives Addressed
- Identify largest and smallest values in a dataset.
- Subtract accurately to find the range.
- Understand range as a measure of data spread.
- Interpret and explain real-world variation in numerical data.
What Your Score Says About You
- Less than 20: You may mix up addition and subtraction or misidentify extremes.
- 21–29: You understand the idea but sometimes make arithmetic slips.
- 31–39: You calculate confidently and interpret results correctly.
- 40 / 40: You’ve fully mastered range and can apply it to any dataset.