Survey 4F
Overview
In this Phlow, students are guided step-by-step through finding the mean (average) from grouped data. Using a small, real-world dataset — for example, goals scored by teams — learners discover how to calculate an average by multiplying, adding, and dividing systematically.
Each question isolates one part of the process: identifying the multiplication step (value × frequency), combining results, and dividing by the total number of entries. The gradual reveal makes the structure of the mean formula intuitive and easy to follow:
Mean = (Sum of all values) ÷ (Number of items)
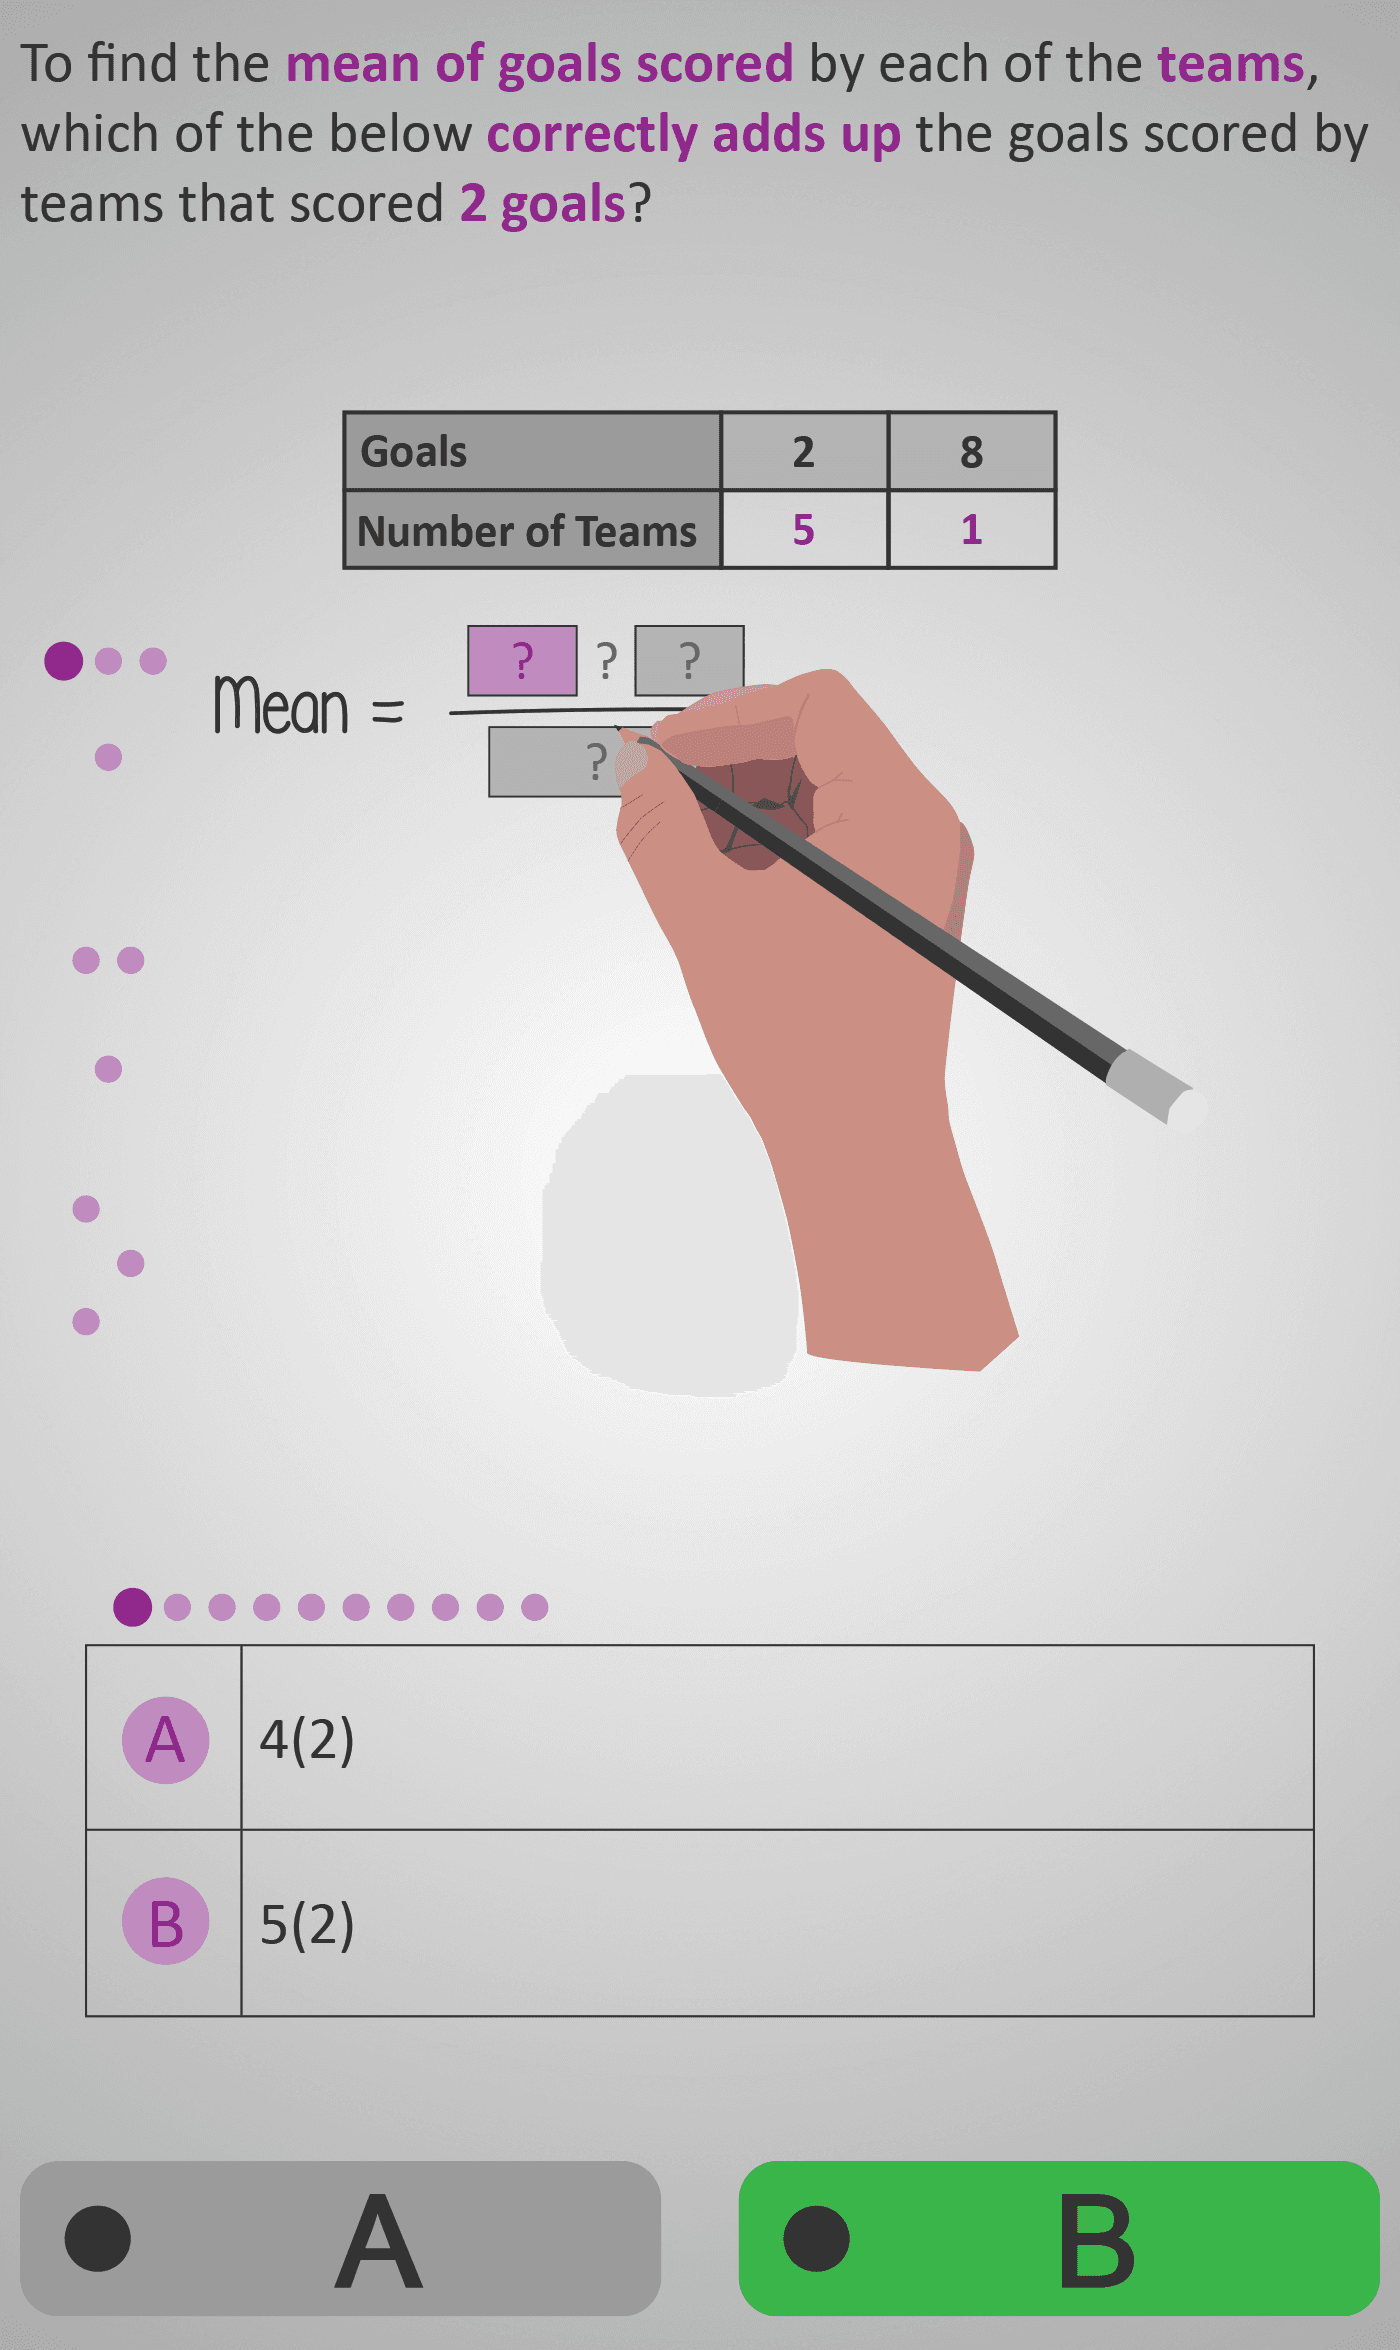
Example:
5(2) + 1(8)
= (10 + 8) ÷ (5 + 1)
= 18 ÷ 6 = 3
Step Sequence
- Identify what each number in the table represents (value vs. frequency).
- Multiply each pair (e.g., goals × number of teams).
- Add all products to find the total number of goals.
- Add all frequencies to find the total number of teams.
- Divide total goals by total teams to find the mean.
Sample Prompts
- What is the total number of goals scored?
- How many teams are there in total?
- What is the mean number of goals scored per team?
- Which expression correctly represents the total?
Why This Matters
The mean connects totals and fairness — it represents how data values are evenly distributed. This Phlow helps learners visualise and compute that process, forming a foundation for statistical reasoning, grouped data interpretation, and everyday data use (e.g., averages in sports or test scores).
Prerequisite Knowledge Required
- Understanding multiplication and division operations.
- Recognising part–whole and total relationships in data.
- Reading data tables accurately.
Linked Phlows:
Survey 4D – Totals from Data Tables,
Survey 4E – Fractions and Part–Whole Reasoning,
Multiplication 3B – Interpreting Simple Products,
Division 3B – Shared Equally Problems,
Averages 3A – Understanding the Mean Conceptually.
Main Category
Data & Statistics
Estimated Completion Time
Approx. 10–14 seconds per question.
40 questions total → Total time: 7–10 minutes.
Cognitive Load / Step Size
Low to moderate. Each micro-step (multiply → add → divide) is introduced separately, ensuring learners master one idea before moving to the next. This tight scaffolding supports deep understanding of the mean formula.
Language & Literacy Demand
Low. Questions are brief and paired with strong visual cues. Mathematical symbols (×, +, ÷) carry most meaning, and key verbs (multiply, add, divide) are colour-coded for clarity. Minimal reading allows students to focus on mathematical reasoning.
Clarity & Design
- Tables clearly show categories and frequencies with shaded headers.
- Visual step indicators and arrows guide learners through each operation.
- Colour-coding distinguishes numerator and denominator when division is introduced.
- The use of a hand-drawn overlay reinforces the human calculation process.
Curriculum Alignment (ROI Junior Cycle Mathematics)
- Strands: Data & Number
- Learning Outcome: Calculate and interpret the mean of a dataset; understand how totals, frequencies, and division combine to represent averages.
Engagement & Motivation
The sports-themed dataset (teams and goals) makes the task relatable and enjoyable. The satisfaction of completing each step and reaching the mean value keeps momentum and builds confidence.
Error Opportunities & Misconceptions
- Adding instead of multiplying frequencies and values.
- Forgetting to sum all products before dividing.
- Dividing by the wrong number (e.g., one category instead of total).
- Confusing order of operations when using a calculator.
Transferability / Real-World Anchoring
Very strong. The same reasoning applies to everyday averages — sports statistics, test results, weather data, and business figures — building statistical literacy for real-life contexts.
Conceptual vs Procedural Balance
Balanced, with conceptual emphasis. While procedural fluency is practised through arithmetic, conceptual understanding is central — learners grasp why we multiply, add, and divide in sequence to find an average.
Learning Objectives Addressed
- Define and calculate the mean using total ÷ frequency.
- Multiply data values by their frequencies to find totals.
- Add partial results to form a grand total.
- Divide accurately to determine the average value.
What Your Score Says About You
- Less than 20: You may be focusing on steps individually — review how multiplication, addition, and division connect.
- 21–29: You understand most steps but sometimes misapply one — check totals and divisors carefully.
- 31–39: You can perform all steps correctly and interpret results — strong conceptual fluency.
- 40 / 40: You demonstrate complete mastery of the mean — able to explain and apply it confidently to grouped data.