


Analyse 4A
Overview
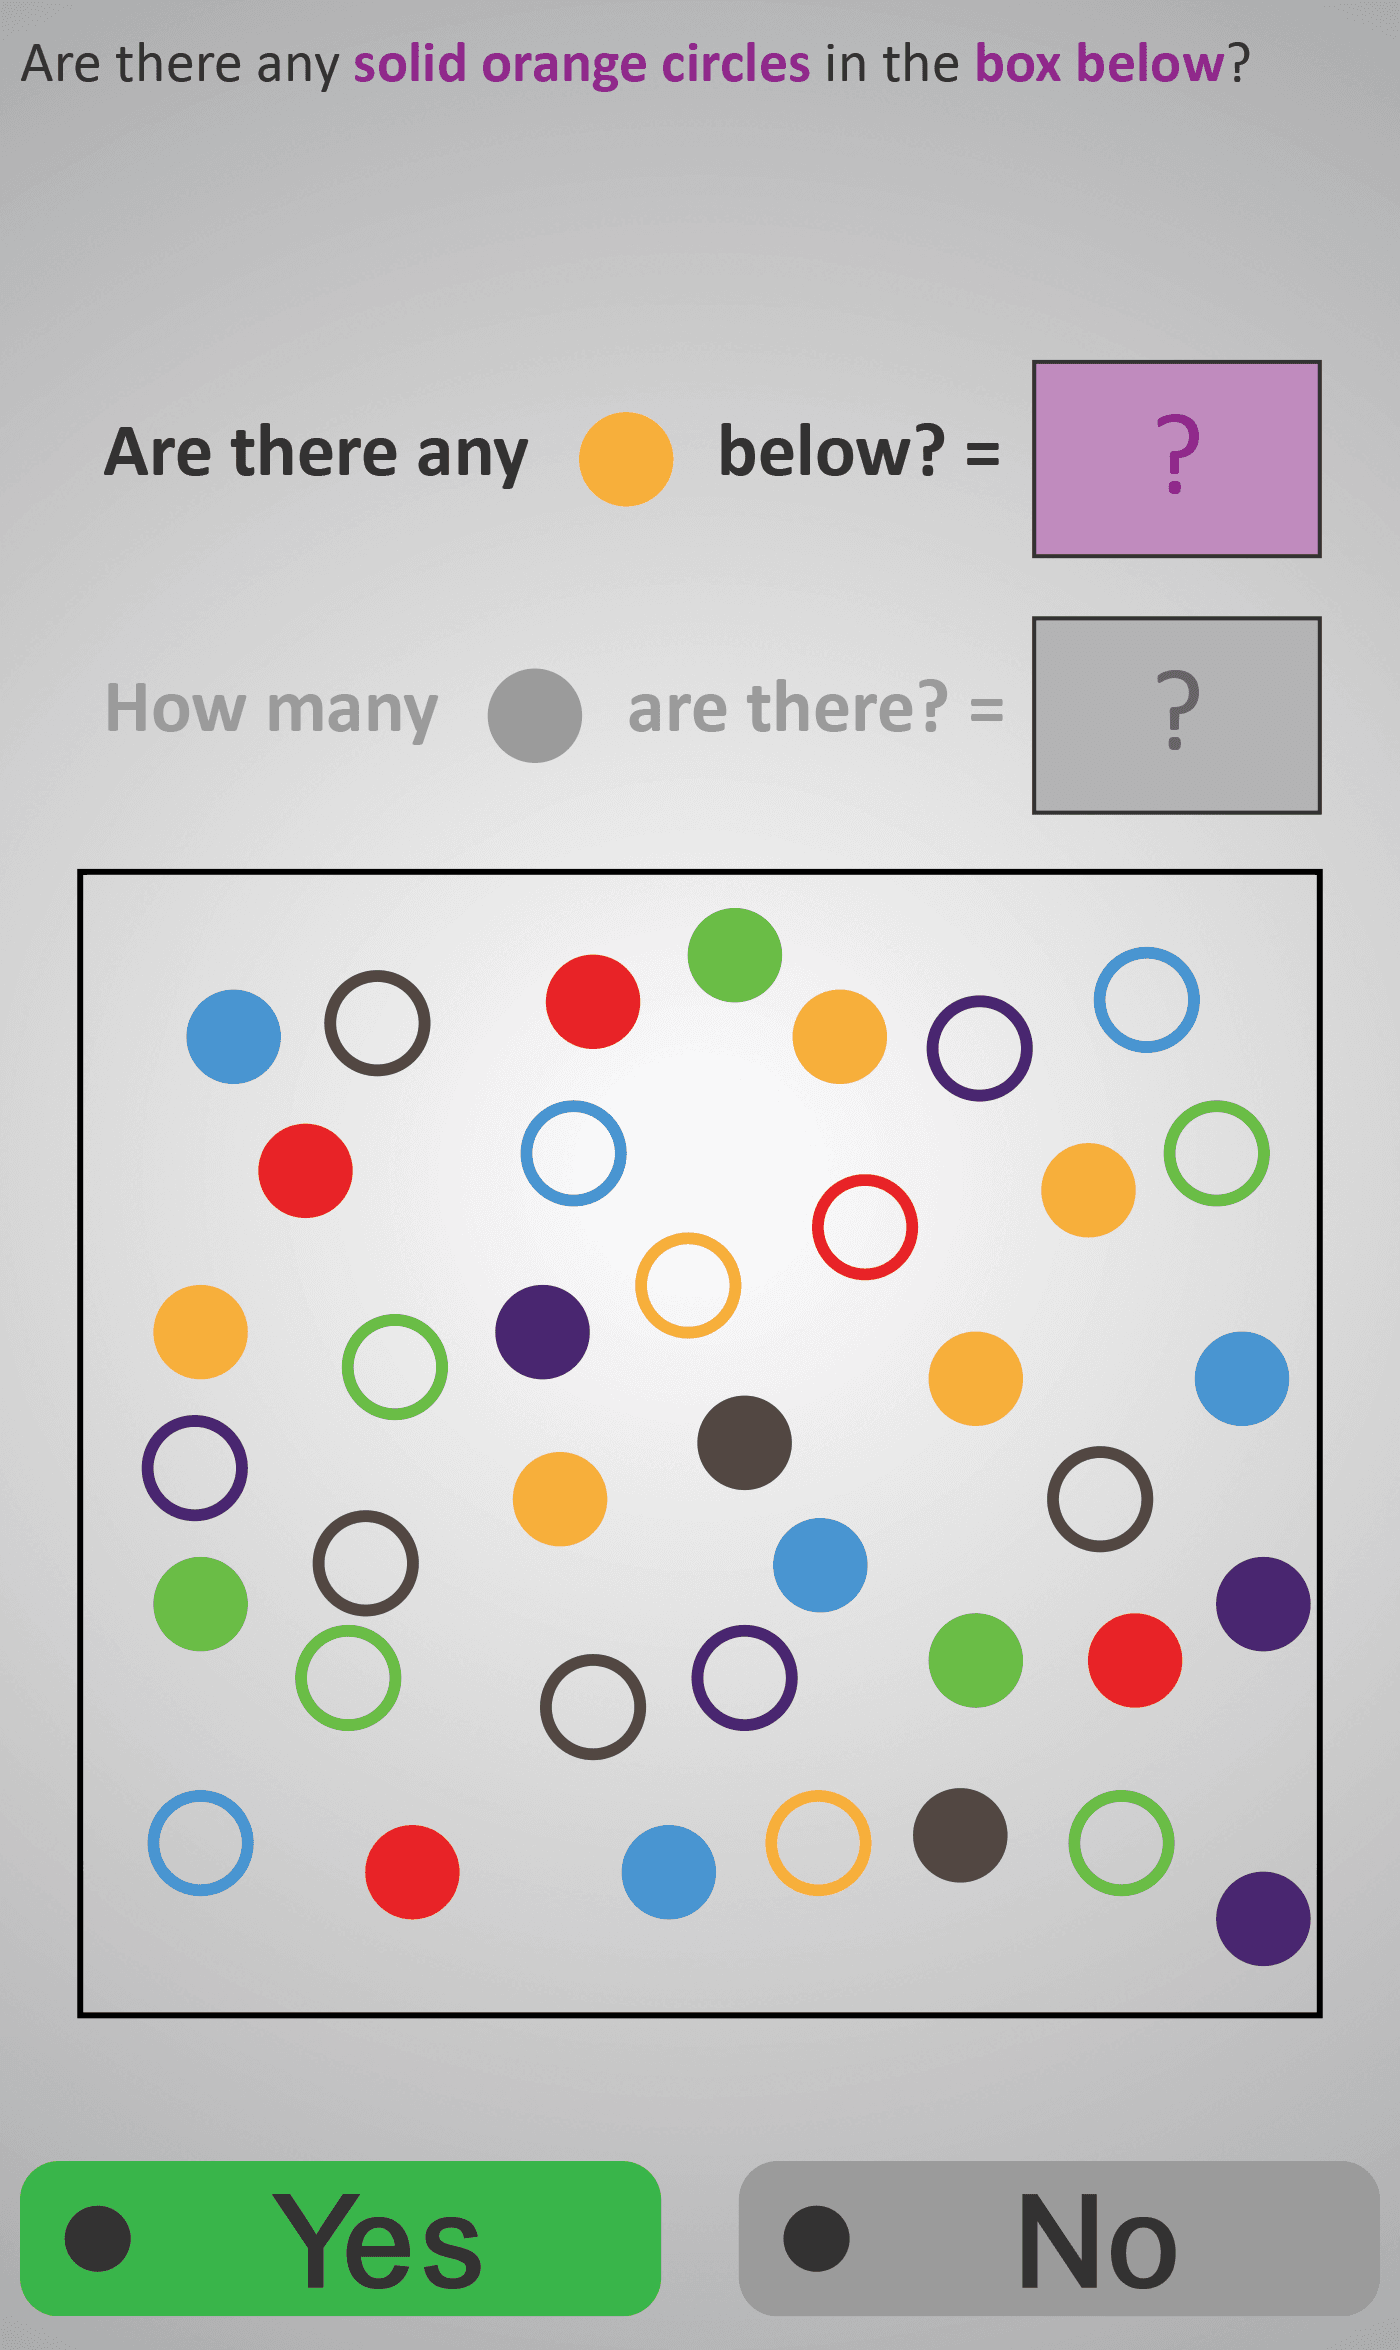
In this Phlow, learners strengthen their analytical observation skills by identifying and counting shapes that match two visual attributes — colour and pattern type (solid or hollow). They are shown grids filled with coloured circles and asked focused questions such as:
- Are there any solid blue circles below?
- How many solid orange circles are there?
- Are there any hollow blue circles in the box below?
Each question encourages learners to locate, differentiate, and count accurately using logical reasoning. By practising with both qualitative (Yes/No) and quantitative (How many?) questions, students progress from recognising features to analysing data. They learn to separate relevant information from distractions — a foundational skill in statistics, probability, and pattern recognition.
This Phlow helps learners transition from simple counting to selective counting, reinforcing how precision and attention to criteria are key in data-based reasoning.
- Identify items matching two attributes: colour + pattern type.
- Count selected items accurately within a mixed set.
- Respond logically to Yes/No and How Many questions.
- Develop systematic visual scanning strategies.
Prerequisite Knowledge Required
- Recognition of basic colours (red, blue, yellow, green, orange, purple, brown).
- Understanding the difference between solid and hollow shapes.
- Ability to count small sets accurately and compare quantities.
- Familiarity with Yes/No questioning and applying criteria to visuals.
- Linked earlier Phlows: Analyse 3B – Spotting and Counting Shapes by Colour; Shape 2C – Recognising Circles and Patterns.
Main Category
Analyse → Visual Sorting → Counting by Feature
Estimated Completion Time
Approx 7–8 minutes (4–5 guided questions).
Learning Outcomes
- Identify items matching two given attributes (colour + pattern).
- Accurately count specific items within a mixed dataset.
- Respond logically to qualitative and quantitative prompts.
- Explain reasoning in comparative terms (e.g., “There are more solid than hollow circles”).
Cognitive Load / Step Size
Low–moderate — tasks first isolate one variable (colour or fill type) before combining both. This progressive layering allows focus without overloading working memory and promotes methodical visual scanning.
Language & Literacy Demand
Low — concise vocabulary such as “solid,” “hollow,” “below,” and “how many” is reinforced visually. Purple highlighting draws attention to key action words, helping learners link text to visual meaning.
Clarity & Design
- Colour-coded prompts clearly match visual grids.
- Consistent “Are there any?” then “How many?” rhythm reinforces understanding.
- Alternating question types maintain engagement and attention to criteria.
- Visual consistency reduces distraction and encourages systematic scanning.
Curriculum Alignment
Strand: Data and Chance
Learning Outcome: Students classify and represent objects based on multiple properties, interpret simple data, and count elements that satisfy given conditions.
(Aligned with Junior Cycle Mathematics – Strand 2: Statistics and Probability, Learning Outcome 2.4.)
Engagement & Motivation
The colourful visuals and quick response cycle make the task interactive and rewarding. Each correct selection reinforces focus, logical reasoning, and observation accuracy, creating an engaging, low-stakes environment that builds analytical confidence.
Error Opportunities & Misconceptions
- Confusing solid with hollow shapes.
- Counting all items of a colour instead of matching both attributes.
- Missing items near grid edges.
The two-step questioning structure encourages double-checking, preventing these errors and supporting self-correction through repetition.
Transferability / Real-World Anchoring
Visual analysis skills apply directly to interpreting charts, sorting data in science experiments, recognising colour-coded categories, and identifying items in real-world settings — from maps and icons to supermarket packaging.
Conceptual vs Procedural Balance
Conceptual focus — learners build the habit of classifying by multiple attributes — paired with procedural reinforcement through structured counting. This balance nurtures both precision and reasoning.
What Your Score Says About You
- Below 20: Needs to slow down and ensure both features are matched correctly.
- 21–30: Understands attributes but may rush or overlook details.
- 31–39: Strong observation and consistent accuracy.
- 40 / 40: Mastery — demonstrates systematic, logical, and confident visual reasoning.